
Fig. 7
- ID
- ZDB-FIG-240620-50
- Publication
- Gauthier et al., 2024 - Therapeutic antibody engineering for efficient targeted degradation of membrane proteins in lysosomes
- Other Figures
- All Figure Page
- Back to All Figure Page
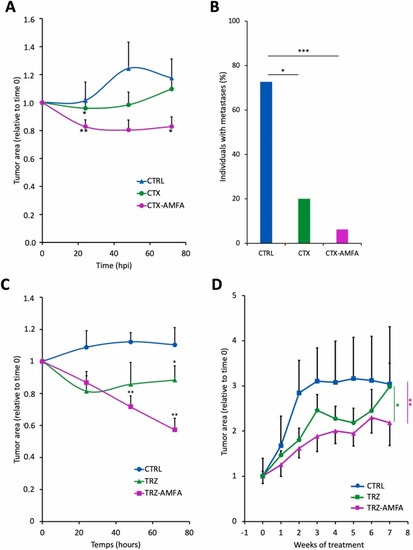
Growth inhibition of xenografted tumors by mAb and mAb-AMFA in zebrafish embryos and mice. (A) Tumor growth inhibition in casper zebrafish xenografted embryos treated with CTX or CTX-AMFA. Embryos were xenografted with human HT-29 cells and intravenously injected with 5 ng of CTX (n=15) or CTX-AMFA (n=16) or 5 % glucose solution for CTRL group (n=11) and were monitored for 72 hpi. Data represent tumor growth rate ± SEM over time. One-way ANOVA Tukey’s test was realized for statistical analysis. At 24 h, CTRL/CTX-AMFA p value < 0.01, CTRL/CTX p value < 0.05; at 72 h CTRL/CTX-AMFA p value < 0.05 (B) Metastasis development. Data represent the percentage of untreated or CTX or CTX-AMFA treated embroys presenting at least one metastasis at 72 hpi. Fisher’s exact test was performed for statistical analysis. (C) Tumor growth inhibition in casper zebrafish xenografted embryos treated with TRZ or TRZ-AMFA. Embryos were xenografted with human SKOV3 cells and intravenously injected with 3.6 ng TRZ (n=9) or TRZ-AMFA (n=9) or 5 % glucose solution for control (CTRL, n=7) and were monitored for 72 hpi. Data represent the tumor growth rate ± SEM over time. One-way ANOVA Tukey’s test was realized for statistical analysis. At 48 h CTRL/TRZ-AMFA p value < 0.01, at 72 h CTRL/TRZ-AMFA p value < 0.01 and TRZ/TRZ-AMFA p value < 0.05 (D). Tumor growth inhibition in xenografted mice treated with TRZ and TRZ-AMFA. BALB/c nudenu/nu female mice were xenografted with human SKOV3 cells and received 8 weekly injections of 6 mg/kg TRZ (n=6) or TRZ-AMFA (n=6) or PBS for control mice (CTRL; n=4). Data represent the mean ± SEM of tumor area relative to time 0 over treatment weeks. Mixed effect analysis model together with Tukey’s test was performed for statistical analysis to compare treatment curves. CTRL/TRZ-AMFA p <0.01, TRZ/TRZ-AMFA p <0.05. * p value < 0.05; ** p value < 0.01; *** p value < 0.001. |