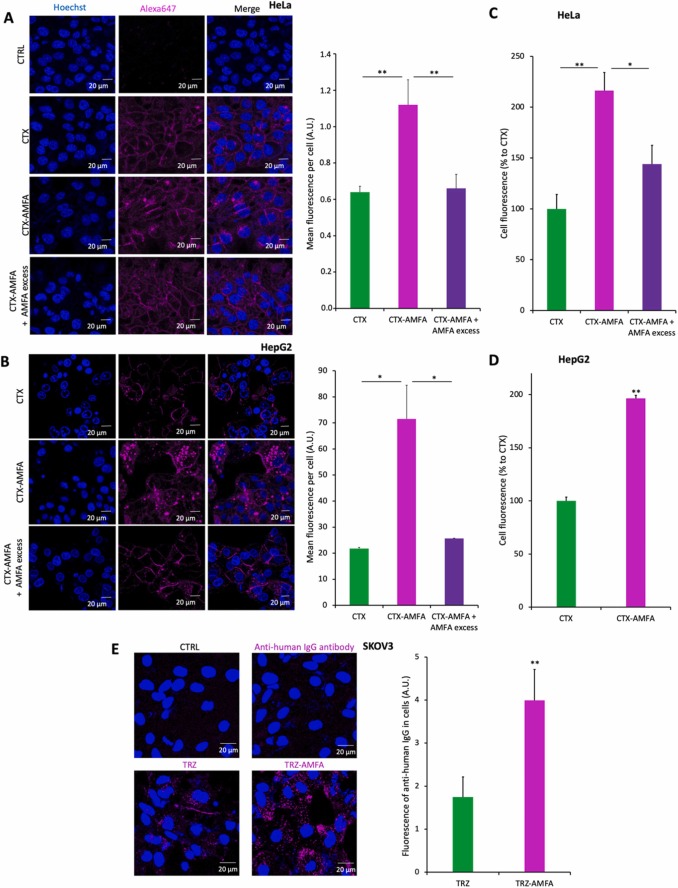
Fig. 3 Internalization of mAb and mAb-AMFA into cells. (A-B) Internalization of CTX or CTX-AMFA by confocal microscopy. HeLa cells (A) or HepG2 cells (B) were treated for 5 h with 5 nM CTX or CTX-AMFA which were detected with 2.5 nM anti-human IgG antibody coupled to AlexaFluor647Ⓡ. A·20 mM AMFA excess was used to prevent the cell uptake mediated by M6PR. Results are presented as the mean fluorescence ± SEM per cell determined in 30 cells. (C-D). Internalization of CTX and CTX-AMFA by flow cytometry. HeLa (C) and HepG2 cells (D) were treated with 5 nM CTX or CTX-AMFA labeled with AlexaFluor488Ⓡ for 5 h. An excess of 20 mM AMFA was used to inhibit CTX-AMFA cell uptake mediated by M6PR. Data are expressed as the percentage ± SEM of cell fluorescence compared to CTX (n=2). (E) Internalization of TRZ and TRZ-AMFA by confocal microscopy. SKOV3 cells were treated with 5 nM TRZ or TRZ-AMFA and with 2.5 nM anti-human IgG antibody coupled with AlexaFluor647Ⓡ for 24 h. Microscopy was performed on living cells and data are expressed as the mean fluorescence ± SD of antibody per cell quantified in 60 cells. Tukey’s test was performed for multiple comparisons. Student’s t-test was performed for paired analysis: * p value < 0.05; ** p value < 0.01.
Image
Figure Caption
Acknowledgments
This image is the copyrighted work of the attributed author or publisher, and
ZFIN has permission only to display this image to its users.
Additional permissions should be obtained from the applicable author or publisher of the image.
Full text @ Biomed. Pharmacother.

