FIGURE SUMMARY
Title

Rare coding variants in NOX4 link high ROS levels to psoriatic arthritis mutilans

Authors
Wang, S., Nikamo, P., Laasonen, L., Gudbjornsson, B., Ejstrup, L., Iversen, L., Lindqvist, U., Alm, J.J., Eisfeldt, J., Zheng, X., Catrina, S.B., Taylan, F., Vaz, R., Ståhle, M., Tapia-Paez, I.
Source
Full text @ EMBO Mol. Med.

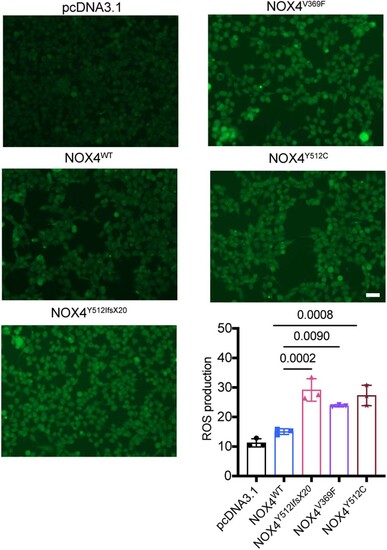
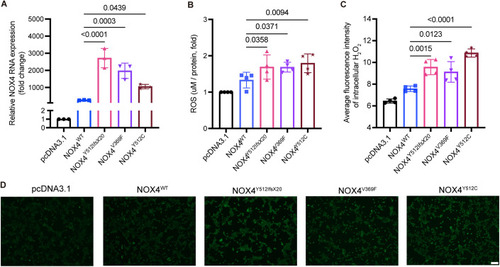
Elevated ROS levels in HEK293 stable transfected cell lines expressing NOX4 variants. HEK293 cells were subjected to 12 h of serum starvation after stably transfection with following plasmids: pcDNA3.1, NOX4wt, NOX4Y512IfsX20, NOX4Y512C, and NOX4V369F. Fluorescence imaging was conducted following the incubation with 10 ?M DCFH-DA. Representative photomicrographs of the fluorescence are displayed and quantification of the mean fluorescence intensity was performed with ImageJ software. N = 3. Scale bars: 100 ?m. Data information: DCFH-DA 2?,7?-dichlorofluorescein diacetate. Data presented as mean ± SD. N = biological replicates. The P value was calculated by the ordinary one-way ANOVA multiple comparisons with Turkey correction of multiple hypothesis tests. Source data are available online for this figure.

Impact of ROS on osteoclasts differentiation from PsA961 (NOX4Y512C). (A) Cells were cultured in the presence of M-CSF or M-CSF and RANKL. Visualization of ROS detected by DCFH-DA on Day 6 and Day 11, indicating a higher ROS effect in PsA961-differentiated osteoclasts. Scale bar: 100 ?m. (B) The relative fluorescence intensity of ROS was quantified by GraphPad Prism9.0.0. N = 3. Data information: DCFH-DA 2?,7?-dichlorofluorescein diacetate. N = biological replicates. For graph (B), error bars in figure represent mean ± SD (two-way ANOVA with Tukey?s multiple comparisons tests). Source data are available online for this figure.

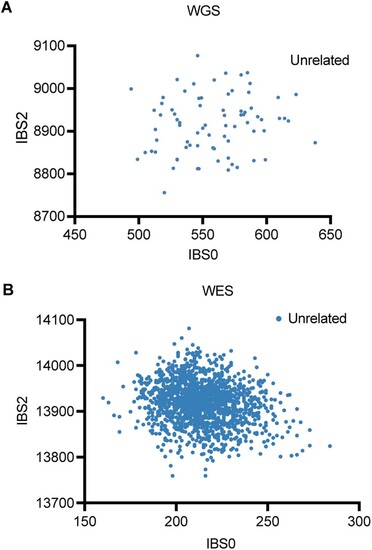
Relatedness plot for WGS (A) and WES (B) samples. (A) Relatedness plot for WGS samples. Six samples from the SweGene database (https://swefreq.nbis.se/) were added to the WGS analysis. Each dot represents a pair of samples. (B) Relatedness analysis of all WES samples. Data information: IBS0 is the number of sites where 1 sample is homozygous for the reference allele and the other is homozygous for the alternate allele. IBS2, is the count of sites where a pair of samples were both homozygous or both heterozygous. WGS Whole-Genome Sequencing, WES Whole-Exome Sequencing. Source data are available online for this figure.

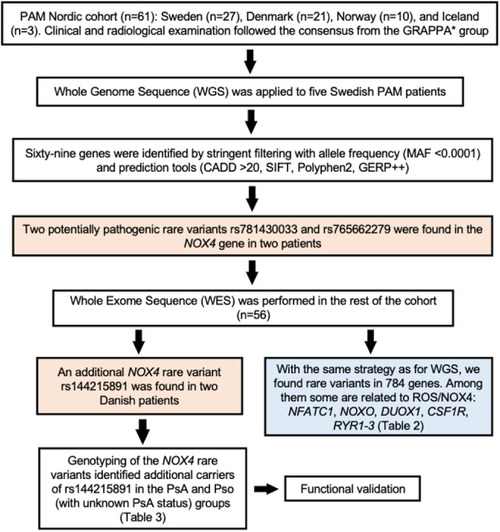
Flowchart outlining the study design and the criteria applied in the filtering of rare variants found in PAM patients by next-generation sequencing.

Data information: *GRAPPA Group for Research and Assessment of Psoriasis and Psoriatic Arthritis. Source data are available online for this figure.

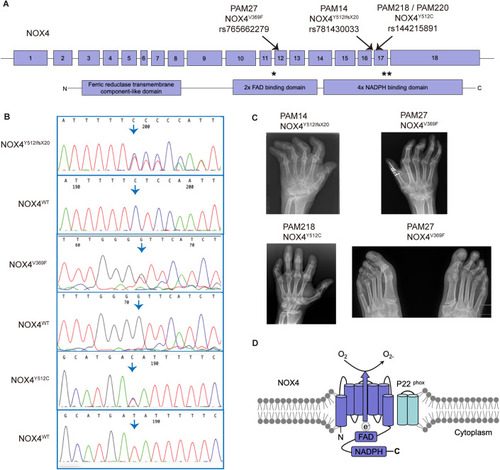
Next-generation sequencing reveals rare variants in the NOX4 gene in PAM patients.

(A) NOX4 gene structure is shown, exons are denoted as boxes, and the three rare variants found in PAM patients are marked by arrows; below, protein domains are indicated, stars show the position of the variants in the protein. (B) Sanger sequencing of the patients validated the findings from next-generation sequencing, heterozygous variants in NOX4 are shown: p.V369F, p.Y512IfsX20, and p.Y512C. Arrows highlight the nucleotide change or the start of the frameshift. (C) Patient radiographs of the hands show Pencil-in-cup deformities in metacarpophalangeal joints, osteolysis and ankylosis in proximal interphalangeal joints and destruction of the wrist (os carpale) (severe in PAM14, milder in PAM218). Feet: Severe osteolysis of the interphalangeal (IP) joints on the left side. Ankylosis of the first IP joint. The mutations found in patients are denoted NOX4Y512IfsX20, NOX4Y512C, and NOX4V369F. (D) Molecular structure of NOX4. Six transmembrane domains are represented by cylinders, cytosolic domains including FAD and NADPH-binding domains are shown as boxes. e electron, FAD flavin cofactor, NADPH nicotinamide adenine dinucleotide phosphate.

HEK293 cell lines overexpressing the rare variants found in NOX4 increased NOX4 expression and reactive oxygen species (ROS) generation compared to cells overexpressing NOX4wt.

(A) The expression of NOX4 was analyzed by qRT-PCR of cells extracted from HEK293 stable transfected cells expressing pcDNA3.1 (empty vector), NOX4wt (wild-type), NOX4Y512IfsX20, NOX4Y512C, and NOX4V369F. β-actin levels were used as a loading control. Relative levels of NOX4 were quantified from three independent experiments. N = 3. (B) All NOX4 rare variants expressing cells have a higher generation of ROS compared to NOX4wt. N = 4. (C) The generation of H2O2 was assessed using the 1 mM BioTracker Green H2O2 live-cell dye for 20 min in HEK293 stable transfected cells. The mean fluorescence intensity of H2O2 was quantified using ImageJ. N = 4. (D) Representative immunofluorescence images of H2O2 levels in HEK293 cells expressing NOX4 rare variants. Scale bar: 100 μm. Data information: H2O2 hydrogen peroxide. N =  biological replicates. For graphs (AC), data are shown as mean ± SEM based on the ordinary one-way ANOVA compared to NOX4wtSource data are available online for this figure.

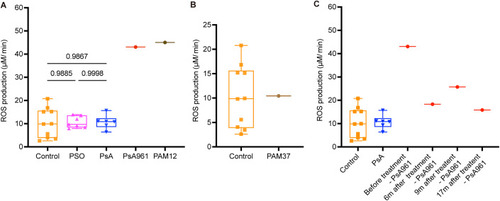
Electron paramagnetic resonance (EPR) shows increased levels of ROS in the patients PAM12 and PsA961 and the impact of anti-TNF-α treatment in PsA961.

(A) ROS measurement by EPR shows increase in PsA961 (NOX4Y512C carrier, red dot) and PAM12 (dark brown dot) compared to controls (n = 10, square), PSO (n = 7, triangle), PsA (n = 6, inverted triangle) from peripheral blood. (B) ROS measurement of the PAM37 patient (light brown dot) undergoing anti-TNFα treatment shows no difference compared to samples from healthy controls (n = 10). (C) ROS levels of the PsA961 patient decreased after anti-TNF treatment. Peripheral blood samples were obtained on four occasions: before treatment, six months (6 m), nine months (9 m) and seventeen months (17 m) after treatment. Data information: PsA961 is a carrier of NOX4Y512C. n =  biological replicates. Each symbol represents the average measurement of two technical replicates for each individual. The box and whisker plots display data distribution through the minimum, first quartile, median, third quartile, and maximum. For graph (A), the P values were calculated by one-way ANOVA, followed by Tukey’s multiple comparisons correction. Source data are available online for this figure.

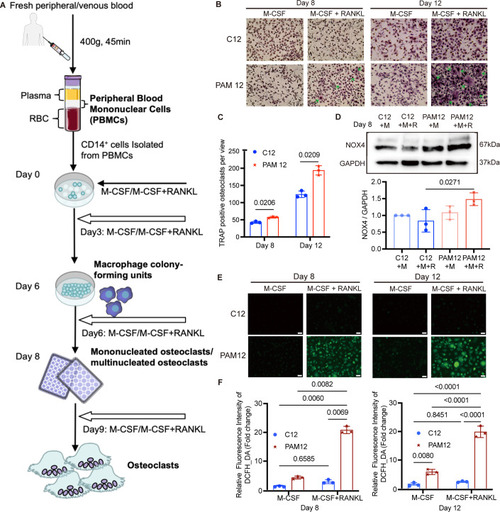
PAM12-derived osteoclasts show enhanced differentiation and increased ROS generation activity compared to osteoclast-derived cells from healthy control.

(
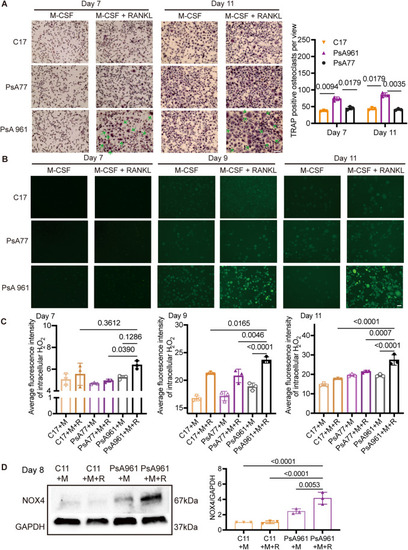
A) Schematic illustration of isolation of osteoclasts from peripheral blood. More details are shown under “Methods”. (B) Osteoclasts were differentiated with colony-stimulating factor (M-CSF/M) and receptor activator of nuclear factor κB ligand (RANKL/R). Tartrate-resistant acid phosphatase (TRAP) staining (violet-labeled) was used to mark differentiated osteoclast (> 3 nuclei). PAM12-derived cells show a higher number of differentiated osteoclasts (marked by arrows) compared to cells derived from a healthy control (C12). (C) The number of TRAP-positive osteoclasts per view was counted blindly by 2 persons. N = 3. (D) Western blot detected the NOX4 protein expression in differentiated osteoclasts derived from PAM12 and C12 on Day 8, and GAPDH was used as a loading control. N = 3. (E) ROS probed by DCFH-DA in cells from PAM12 was significantly higher compared to control cells at both 8 and 12 days after differentiation with M-CSF and RANKL. Representative images are shown. N = 3. (F) The average fluorescence intensity was quantified by ImageJ software at two time points. N = 3. Data information: scale bars = 100 μm. N =  biological replicates. (C, D, F) Error bars in figures represent mean ± SEM. One-way ANOVA with Tukey’s multiple comparisons test was used to determine significant differences. Source data are available online for this figure.

PsA961 (NOX4Y512C) derived osteoclasts show enhanced differentiation and increased hydrogen peroxide generation activity compared to a PsA patient (non-carrier of NOX4 rare variants) and to a healthy control.

(A) Osteoclasts were induced through differentiation using colony-stimulating factor (M-CSF/M) and receptor activator of nuclear factor κB ligand (RANKL/R). Differentiated osteoclast with more than three nuclei were identified through tartrate-resistant acid phosphatase (TRAP) staining (violet-labeled). Notably, cells derived from PsA961 patient carrying the NOX4Y512C variant shown a higher numbers of differentiated osteoclasts (indicated by arrows) compared to age-gender-matched PsA77 patient without NOX4 variants. N = 3. (B) Hydrogen peroxide (H2O2) levels, probed by a green dye in cells from PsA961 patients, were significantly higher compared to control cells (C17 and PsA77) at different time points after differentiation with M-CSF and RANKL. Representative images are shown. (C) The average fluorescence intensity was quantified by ImageJ software at three time points. N = 3. (D) In differentiated osteoclast (Day 8) NOX4 protein levels were higher in PsA961 compared to a healthy control—C11. GADPH levels were used as a loading control. N = 3. Data information: H2O2 hydrogen peroxide. Scale bars = 100 μm. N =  biological replicates. For graphs (A, C, D), error bars in figures represent mean ± SEM. One-way ANOVA with Tukey’s correction for multiple testing was used. Source data are available online for this figure.

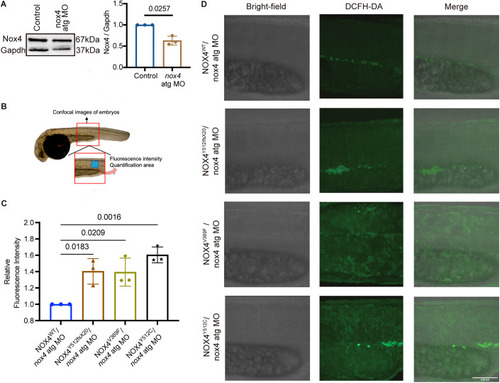
ROS production is increased in zebrafish embryos injected with NOX4 mRNA variants compared to NOX4wt.

(A) Endogenous Nox4 was reduced by co-injecting embryos with a translation-blocking morpholino (nox4 atg MO), resulting in a 50% reduction of Nox4 compared to mock-injected controls. Gapdh was used as loading control. N = 3. (B) ROS production was assessed by imaging zebrafish embryos (red box) and quantifying the fluorescence intensity in the area marked by the blue box. (C) Quantification of fluorescence intensity shows a significant increase in the embryos co-injected with NOX4 variants mRNA and nox4 atg MO compared to NOX4wt and nox4 atg MO The number of zebrafish embryos imaged in each experimental group is listed in Appendix Table S7. In total, 9–16 zebrafish embryos were used for each repeat. N = 3. (D) Representative images of injected embryos exposed to DCFH-DA (scale bars = 100 μm). Data information: DCFH-DA 2′,7′-dichlorofluorescein diacetate. N =  biological replicates. Values are mean ± SEM. For graph (A), the difference between two groups was determined by the Student’s t test. For graph (C), ordinary two-way ANOVA with Tukey’s multiple comparisons test was used to determine significant differences. Source data are available online for this figure.

Acknowledgments
This image is the copyrighted work of the attributed author or publisher, and ZFIN has permission only to display this image to its users. Additional permissions should be obtained from the applicable author or publisher of the image. Full text @ EMBO Mol. Med.