IMAGE

Figure 5

ID
ZDB-IMAGE-240318-56
Source
Figures for Wang et al., 2024
Image
Figure Caption

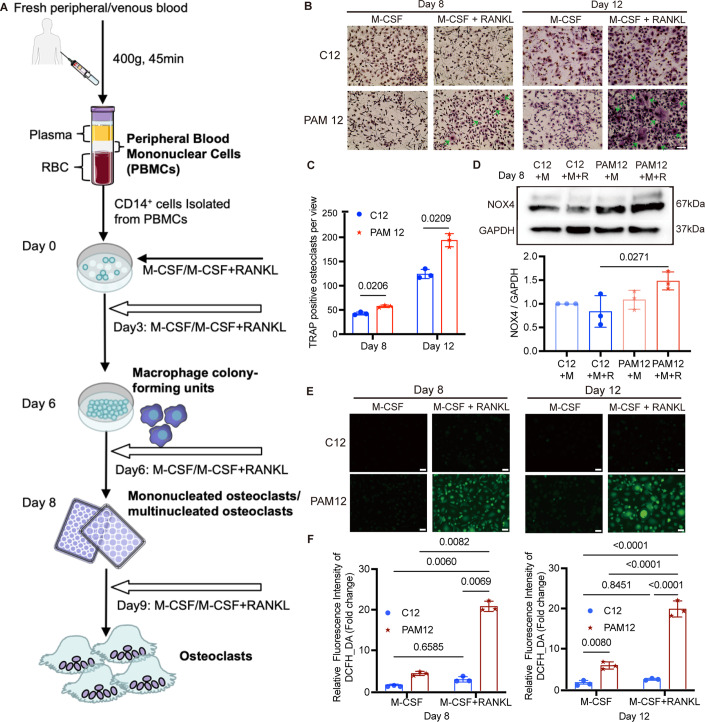
Figure 5 PAM12-derived osteoclasts show enhanced differentiation and increased ROS generation activity compared to osteoclast-derived cells from healthy control.

(A) Schematic illustration of isolation of osteoclasts from peripheral blood. More details are shown under “Methods”. (B) Osteoclasts were differentiated with colony-stimulating factor (M-CSF/M) and receptor activator of nuclear factor κB ligand (RANKL/R). Tartrate-resistant acid phosphatase (TRAP) staining (violet-labeled) was used to mark differentiated osteoclast (> 3 nuclei). PAM12-derived cells show a higher number of differentiated osteoclasts (marked by arrows) compared to cells derived from a healthy control (C12). (C) The number of TRAP-positive osteoclasts per view was counted blindly by 2 persons. N = 3. (D) Western blot detected the NOX4 protein expression in differentiated osteoclasts derived from PAM12 and C12 on Day 8, and GAPDH was used as a loading control. N = 3. (E) ROS probed by DCFH-DA in cells from PAM12 was significantly higher compared to control cells at both 8 and 12 days after differentiation with M-CSF and RANKL. Representative images are shown. N = 3. (F) The average fluorescence intensity was quantified by ImageJ software at two time points. N = 3. Data information: scale bars = 100 μm. N =  biological replicates. (C, D, F) Error bars in figures represent mean ± SEM. One-way ANOVA with Tukey’s multiple comparisons test was used to determine significant differences. Source data are available online for this figure.

Acknowledgments
This image is the copyrighted work of the attributed author or publisher, and ZFIN has permission only to display this image to its users. Additional permissions should be obtained from the applicable author or publisher of the image. Full text @ EMBO Mol. Med.