
Fig. EV1
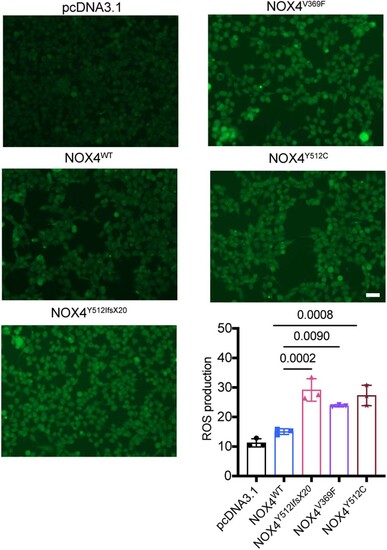
Elevated ROS levels in HEK293 stable transfected cell lines expressing NOX4 variants. HEK293 cells were subjected to 12 h of serum starvation after stably transfection with following plasmids: pcDNA3.1, NOX4wt, NOX4Y512IfsX20, NOX4Y512C, and NOX4V369F. Fluorescence imaging was conducted following the incubation with 10 μM DCFH-DA. Representative photomicrographs of the fluorescence are displayed and quantification of the mean fluorescence intensity was performed with ImageJ software. N = 3. Scale bars: 100 μm. Data information: DCFH-DA 2′,7′-dichlorofluorescein diacetate. Data presented as mean ± SD. N = biological replicates. The P value was calculated by the ordinary one-way ANOVA multiple comparisons with Turkey correction of multiple hypothesis tests. Source data are available online for this figure. |