
|
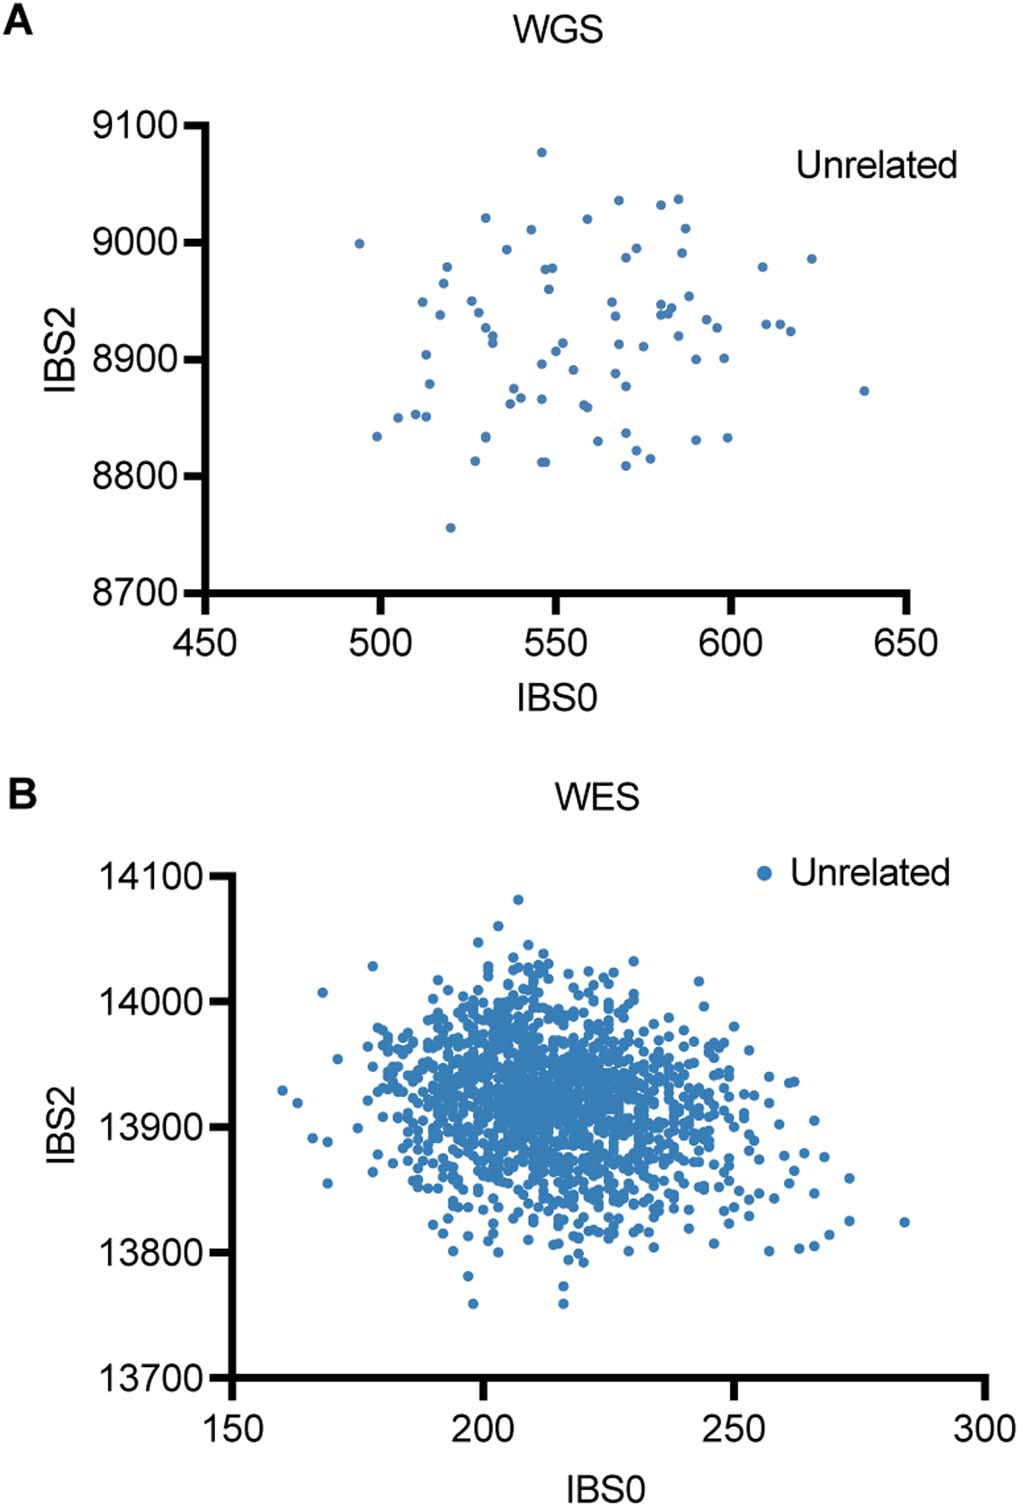
Fig. EV3 Relatedness plot for WGS (A) and WES (B) samples. (A) Relatedness plot for WGS samples. Six samples from the SweGene database (https://swefreq.nbis.se/) were added to the WGS analysis. Each dot represents a pair of samples. (B) Relatedness analysis of all WES samples. Data information: IBS0 is the number of sites where 1 sample is homozygous for the reference allele and the other is homozygous for the alternate allele. IBS2, is the count of sites where a pair of samples were both homozygous or both heterozygous. WGS Whole-Genome Sequencing, WES Whole-Exome Sequencing. Source data are available online for this figure.