IMAGE

Figure 3

ID
ZDB-IMAGE-240318-54
Source
Figures for Wang et al., 2024
Image
Figure Caption

Figure 3 
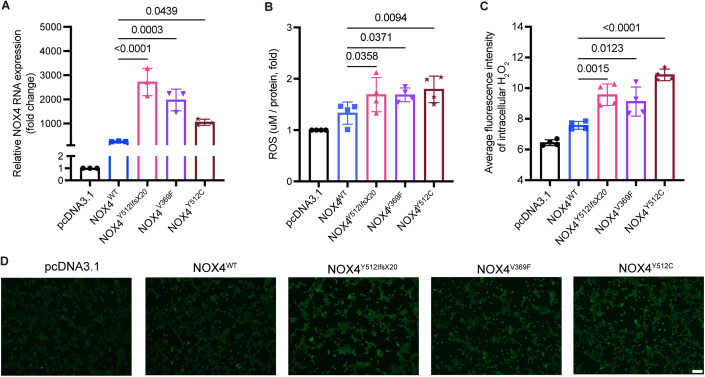
HEK293 cell lines overexpressing the rare variants found in NOX4 increased NOX4 expression and reactive oxygen species (ROS) generation compared to cells overexpressing NOX4wt.

(A) The expression of NOX4 was analyzed by qRT-PCR of cells extracted from HEK293 stable transfected cells expressing pcDNA3.1 (empty vector), NOX4wt (wild-type), NOX4Y512IfsX20, NOX4Y512C, and NOX4V369F. β-actin levels were used as a loading control. Relative levels of NOX4 were quantified from three independent experiments. N = 3. (B) All NOX4 rare variants expressing cells have a higher generation of ROS compared to NOX4wt. N = 4. (C) The generation of H2O2 was assessed using the 1 mM BioTracker Green H2O2 live-cell dye for 20 min in HEK293 stable transfected cells. The mean fluorescence intensity of H2O2 was quantified using ImageJ. N = 4. (D) Representative immunofluorescence images of H2O2 levels in HEK293 cells expressing NOX4 rare variants. Scale bar: 100 μm. Data information: H2O2 hydrogen peroxide. N =  biological replicates. For graphs (AC), data are shown as mean ± SEM based on the ordinary one-way ANOVA compared to NOX4wtSource data are available online for this figure.

Acknowledgments
This image is the copyrighted work of the attributed author or publisher, and ZFIN has permission only to display this image to its users. Additional permissions should be obtained from the applicable author or publisher of the image. Full text @ EMBO Mol. Med.