IMAGE

Figure 4

ID
ZDB-IMAGE-240318-55
Source
Figures for Wang et al., 2024
Image
Figure Caption

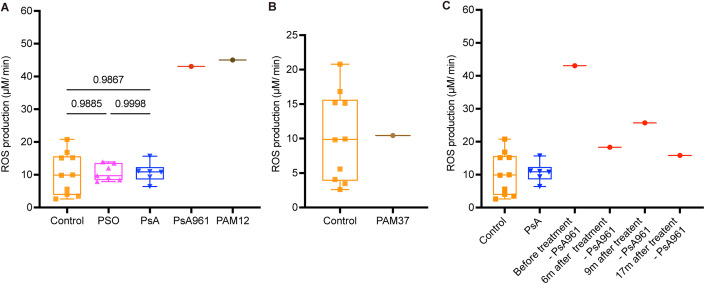
Figure 4 Electron paramagnetic resonance (EPR) shows increased levels of ROS in the patients PAM12 and PsA961 and the impact of anti-TNF-α treatment in PsA961.

(A) ROS measurement by EPR shows increase in PsA961 (NOX4Y512C carrier, red dot) and PAM12 (dark brown dot) compared to controls (n = 10, square), PSO (n = 7, triangle), PsA (n = 6, inverted triangle) from peripheral blood. (B) ROS measurement of the PAM37 patient (light brown dot) undergoing anti-TNFα treatment shows no difference compared to samples from healthy controls (n = 10). (C) ROS levels of the PsA961 patient decreased after anti-TNF treatment. Peripheral blood samples were obtained on four occasions: before treatment, six months (6 m), nine months (9 m) and seventeen months (17 m) after treatment. Data information: PsA961 is a carrier of NOX4Y512C. n =  biological replicates. Each symbol represents the average measurement of two technical replicates for each individual. The box and whisker plots display data distribution through the minimum, first quartile, median, third quartile, and maximum. For graph (A), the P values were calculated by one-way ANOVA, followed by Tukey’s multiple comparisons correction. Source data are available online for this figure.

Acknowledgments
This image is the copyrighted work of the attributed author or publisher, and ZFIN has permission only to display this image to its users. Additional permissions should be obtained from the applicable author or publisher of the image. Full text @ EMBO Mol. Med.