
- Title
-
Vibrio cholerae arrests intestinal epithelial proliferation through T6SS-dependent activation of the bone morphogenetic protein pathway
- Authors
- Xu, X., Foley, E.
- Source
- Full text @ Cell Rep.
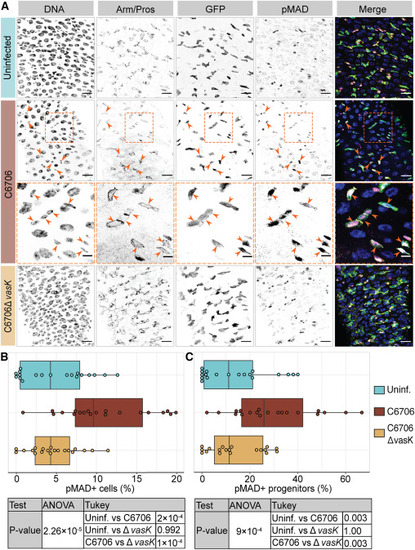
Vc activates BMP in intestinal progenitor cells in a T6SS-dependent manner (A) Posterior midguts of esgts/+ adult fly uninfected or infected with C6706 or C6706ΔvasK for 24 h. Hoechst labels DNA (blue); Armadillo and Prospero (Arm/Pros) label cell borders and enteroendocrine cells, respectively (yellow); GFP labels progenitors (green); and pMAD labels cells with BMP activation (magenta). Arrowheads: pMAD+ GFP+ progenitors. The area within the dashed box of row two is presented at a higher magnification in row three to better illustrate pMAD in progenitors. Scale bars in row three: 5 μm. All other scale bars: 15 μm. (B and C) Percentage of (B) all cells or (C) progenitors that are pMAD+. Each dot represents a measurement from a single fly gut. p values are calculated using the significance tests indicated in the tables |
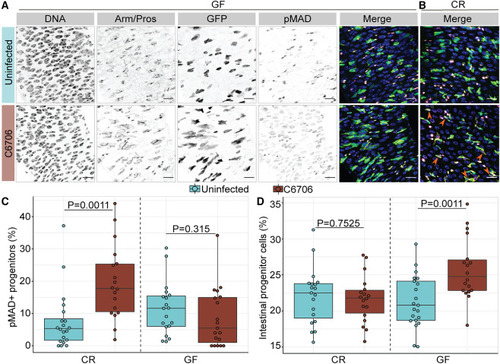
Progenitor-specific activation of BMP signaling requires Vc-commensal interactions (A and B) Posterior midguts of (A) germ-free (GF) or (B) conventionally reared (CR) esgts/+ adult flies uninfected or infected with C6706 for 24 h. Hoechst labels DNA (blue); Arm/Pros label cell borders and enteroendocrine cells, respectively (yellow); GFP labels progenitors (green); and pMAD labels cells with BMP activation (magenta). Scale bars: 15 μm. (C) Percentage of GFP+ progenitors that are pMAD+ in GF and CR esgts/+ flies. (D) Proportion of GFP+ progenitors in all intestinal epithelial cells in GF and CR esgts/+ flies. Each dot represents a measurement from a single fly gut. p values are calculated using unpaired Student’s t tests. |
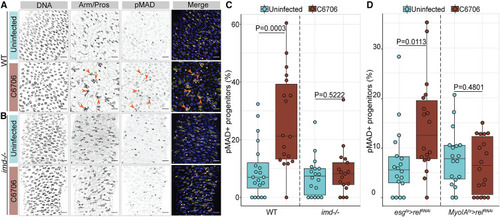
Vc-responsive activation of BMP requires IMD activity (A and B) Posterior midguts of (A) wild-type (WT) and (B) imd null mutant (imd−/−) adult flies uninfected or infected with C6706 for 24 h. Hoechst labels DNA (blue); Arm/Pros label cell borders and enteroendocrine cells, respectively (yellow); and pMAD labels cells with BMP activation (magenta). Arrows: pMAD+ progenitor cells. Scale bars: 15 μm. (C) Percentage of progenitors that are pMAD+ in WT and imd−/− flies. (D) Percentage of pMAD+ progenitors in esgts>relRNAi and Myo1Ats>relRNAi flies. Each dot represents a measurement from a single fly gut. p values are calculated using unpaired Student’s t tests. |
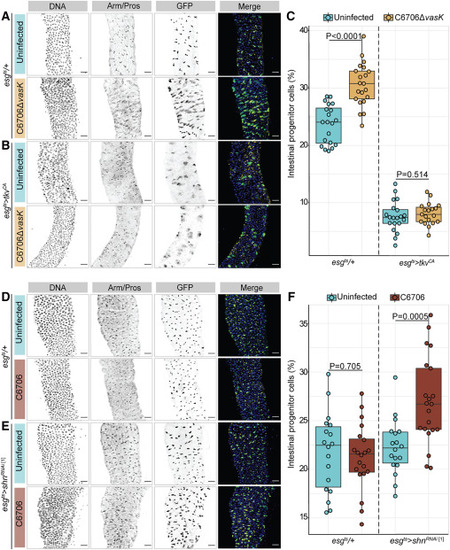
BMP regulates epithelial repair after Vc infection (A and B) Posterior midguts from (A) WT (esgts/+) or (B) progenitor-specific BMP activation (esgts>tkvCA) adult flies uninfected or infected with C6706ΔvasK for 36 h. DNA labeled with Hoechst (blue); GFP marks progenitors (green); and Arm/Pros label cell borders and enteroendocrine cells, respectively (yellow). Scale bar: 25 μm. (C) Proportion of intestinal epithelial cells that are GFP+ progenitors in esgts/+ and esgts>tkvCA flies. (D and E) Images of (D) WT (esgts/+) or (E) progenitor-specific BMP inhibition (esgts>shnRNAi) adult flies uninfected or infected with C6706 for 36 h. DNA labeled with Hoechst (blue); GFP marks progenitors (green); and Arm/Pros label cell borders and enteroendocrine cells, respectively (yellow). Scale bar: 25 μm. (F) Proportion of cells that are GFP+ progenitors in esgts/+ and esgts>shnRNAi flies. Each dot represents a measurement from a single fly gut. p values are calculated using unpaired Student’s t tests. |
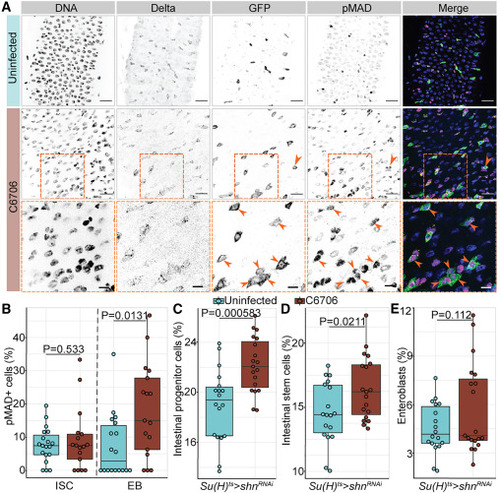
Vc-responsive BMP activation in EBs arrests intestinal stem cell growth non-cell autonomously (A) Posterior midguts of Su(H)ts/+ adult flies uninfected or infected with C6706 for 36 h. Hoechst labels DNA (blue); Delta marks ISCs (yellow); GFP labels Su(H)+ EBs (green); pMAD labels cells with BMP activation (magenta). Arrows and dashed box: pMAD+ GFP+ EBs. Scale bars in dashed boxes: 5 μm. Scale bars in images: 15 μm. (B) Proportion of intestinal stem cells or EBs that are pMAD+ in Su(H)ts/+ intestines. (C–E) Proportions of all cells that are (C) progenitors, (D) ISCs, or (E) EBs in the intestines with EB-specific BMP inactivation (Su(H)ts>shnRNAi). Each dot represents a measurement from a single fly gut. p values are calculated using unpaired Student’s t tests. |
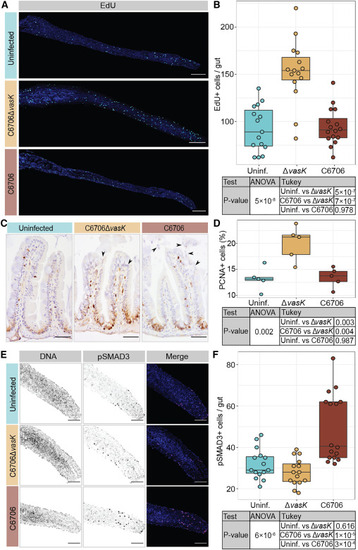
Vc T6SS induces BMP activation and limits cell proliferation in the zebrafish intestine (A) Intestines of TL zebrafish larvae uninfected or Vc infected for 24 h with DNA stained by Hoechst in blue and EdU+ cells in cyan. Scale bars: 200 μm. (B) Quantification of EdU+ cells per gut. (C) Immunohistochemical images of sagittal posterior intestinal sections from adult TL zebrafish uninfected or Vc infected for 24 h stained for PCNA. Arrows indicate epithelial damages marked by disorganized nuclei and shedding of epithelial cells. Scale bars: 50 μm. (D) Percentage of intestinal epithelial cells that are PCNA+ in adult fish guts. (E) Posterior intestines from TL zebrafish larvae uninfected or Vc infected for 24 h with DNA marked by Hoechst in blue and pSMAD3 in magenta. Scale bars: 100 μm. (F) Quantification of pSMAD3+ cells per gut. Each dot represents a measurement from a single fish intestine. p values are calculated using the significance tests indicated in the tables. |
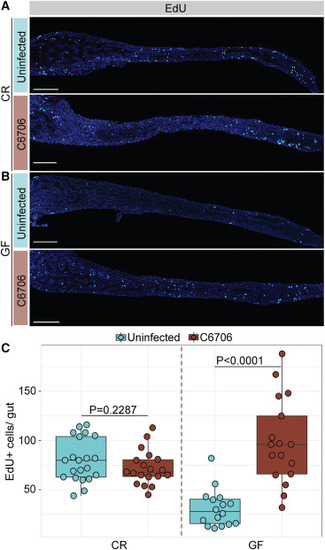
Vc T6SS-responsive arrest of cell proliferation requires commensals in the zebrafish intestine (A and B) Intestines of (A) CR or (B) GF TL zebrafish larvae uninfected or infected with C6706 for 24 h. Hoechst labels DNA (blue), and EdU labels proliferating cells (cyan). Scale bars: 200 μm. (C) Quantification of EdU+ cells per gut. Each dot represents a measurement from a single larval intestine. p values are calculated using unpaired Student’s t tests. |