
|
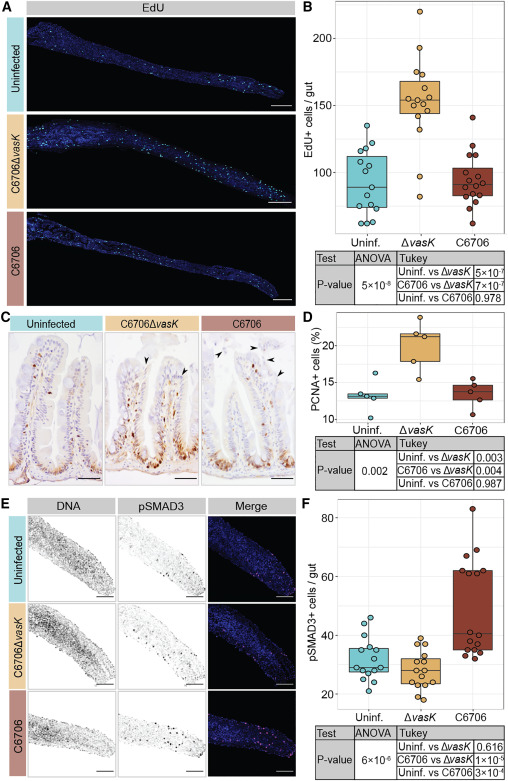
Fig. 6 Vc T6SS induces BMP activation and limits cell proliferation in the zebrafish intestine (A) Intestines of TL zebrafish larvae uninfected or Vc infected for 24 h with DNA stained by Hoechst in blue and EdU+ cells in cyan. Scale bars: 200 μm. (B) Quantification of EdU+ cells per gut. (C) Immunohistochemical images of sagittal posterior intestinal sections from adult TL zebrafish uninfected or Vc infected for 24 h stained for PCNA. Arrows indicate epithelial damages marked by disorganized nuclei and shedding of epithelial cells. Scale bars: 50 μm. (D) Percentage of intestinal epithelial cells that are PCNA+ in adult fish guts. (E) Posterior intestines from TL zebrafish larvae uninfected or Vc infected for 24 h with DNA marked by Hoechst in blue and pSMAD3 in magenta. Scale bars: 100 μm. (F) Quantification of pSMAD3+ cells per gut. Each dot represents a measurement from a single fish intestine. p values are calculated using the significance tests indicated in the tables.