- Title
-
Vitamin D promotes the folate transport and metabolism in zebrafish (Danio rerio)
- Authors
- Liang, S., Zhang, H., Jiao, L., Shao, R., Lan, Y., Liao, X., Mai, K., Ai, Q., Wan, M.
- Source
- Full text @ Am. J. Physiol. Endocrinol. Metab.
|
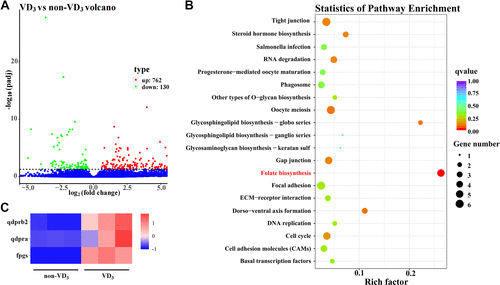
The folate pathway in zebrafish was influenced by dietary VD3. A: volcano plot of differentially expressed genes (DEGs) in the visceral mass of zebrafish-fed diets with VD3 or without VD3. Each dot represents an individual gene (n = 9 fish). The red dots (top) indicate the significantly upregulated genes (P < 0.05), whereas the green dots (bottom) represent the significantly downregulated genes (P < 0.05). B: the top 20 KEGG pathways enriched for DEGs. Rich factor is the ratio of the number of DEGs enriched in a certain pathway to the total number of DEGs (n = 9 fish). C: the heat-map of DEGs related to the folate biosynthesis (n = 9 fish). VD, vitamin D. |
|
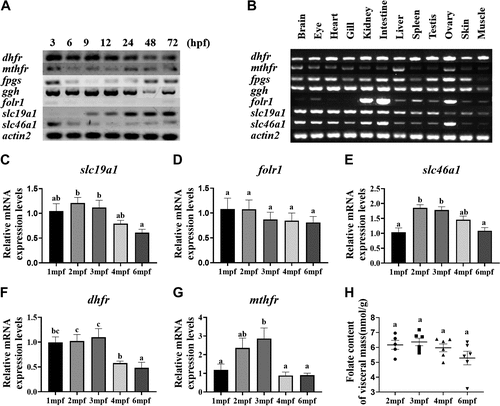
The expression of the genes related to the folate pathway in different tissues and developmental stages of zebrafish. The gene expression of folate transporters and metabolic enzymes in zebrafish at early developmental stages (A) and in different tissues of adult zebrafish (3 mpf) (B). The gene expression of slc19a1 (C), folr1 (D), slc46a1 (E), dhfr (F), and mthfr (G) in the intestine of wild-type zebrafish was assayed at 1, 2, 3, 4, and 6 mpf. The expression levels of the target genes are relative to the levels at 1 mpf. H: the folate content in the visceral mass of wild-type zebrafish at 2, 3, 4, and 6 mpf. Data are presented as means ± SE (n ≥ 5 fish). Different letters indicate significant differences (P < 0.05). dhfr, dihydrofolate reductase; folr1, folate receptor α; fpgs, folylpolyglutamate synthase; ggh, γ-glutamyl hydrolase; mpf, months post fertilization; mthfr, methylenetetrahydrofolate reductase; slc19a1, reduced folate carrier; slc46a1, proton-coupled folate transporter. |
|
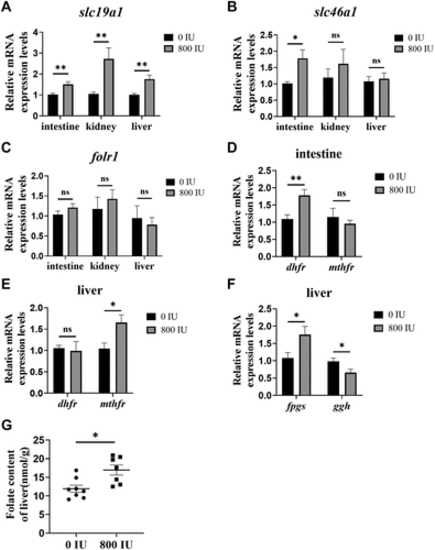
VD3 regulates the folate transport and metabolism in zebrafish. The gene expression of slc19a1 (A), slc46a1 (B), and folr1 (C) in the intestine, kidney, and liver of the zebrafish fed with 0 or 800 IU/kg VD3 diets for 3 wk was analyzed. The gene expression of dhfr and mthfr related to folate one-carbon metabolism in the intestine (D) and liver (E) of the zebrafish fed with 0 or 800 IU/kg VD3 diets for 3 wk was analyzed. F: the gene expression of fpgs and ggh in the liver was analyzed. G: the folate content of liver was measured with microbiological assay. Data are presented as means ± SE (n ≥ 6 fish). *P < 0.05; **P < 0.01; ns, no statistical significance. VD, vitamin D. |
|
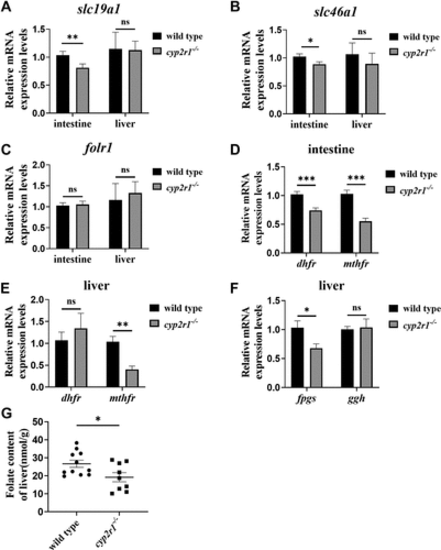
The cyp2r1 interruption caused the disturbance of folate pathway in zebrafish. The gene expression of slc19a1 (A), slc46a1 (B), and folr1 (C) in the intestine and liver of the cyp2r1−/− and wild-type zebrafish was analyzed. The gene expression of dhfr, and mthfr in the intestine (D) and liver (E) of the cyp2r1−/− and wild-type zebrafish was analyzed. F: the gene expression of fpgs and ggh in the liver was analyzed. G: the folate content in liver of the cyp2r1−/− and wild-type zebrafish was measured with microbiological assay. Data are presented as means ± SE (n ≥ 6 fish). *P < 0.05; **P < 0.01; ***P < 0.001; ns, no statistical significance. |
|
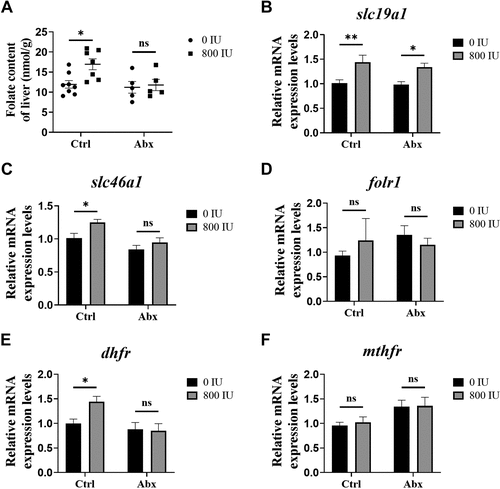
The depletion of the gut microbiota impacted the VD-regulated folate metabolism. Wild-type zebrafish were treated with antibiotics and fed diets containing 0 or 800 IU/kg VD3 for 3 wk. A: the folate content of liver was measured with microbiological assay. The gene expression of slc19a1 (A), slc46a1 (B), folr1 (C), dhfr (D), and mthfr (E) in the intestine was analyzed. Data are presented as means ± SE (n ≥ 5 fish). *P < 0.05; **P < 0.01; ns, no statistical significance. VD, vitamin D. |
|
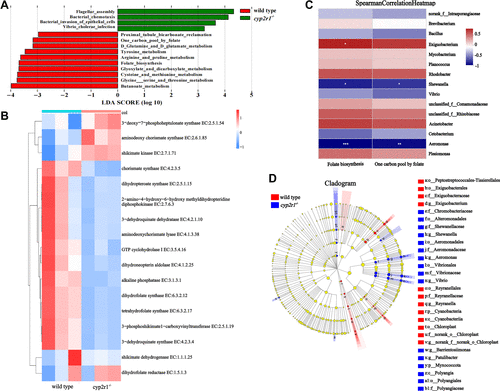
VD affected the functions related to the folate biosynthesis in gut commensals of zebrafish. A: the functional KEGG profiles of gut microbiota in wild-type and cyp2r1–/– zebrafish were predicted based on Tax4Fun analysis (LDA score > 2, P < 0.05). B: the heat-map was constructed to illustrate the differential abundance of the enzymes related to folate biosynthesis in wild-type and cyp2r1–/– zebrafish. The red and blue squares indicate the higher and lower abundance, respectively. C: the Spearman’s correlation between the predicted pathways of folate biosynthesis and the dominant genus in the gut microbiota was displayed. *P < 0.05; **P < 0.01; ***P < 0.001. D: the cladogram showing differentially abundant taxa in the gut microbiota of wild-type and cyp2r1–/– zebrafish. The enriched taxa in the wild-type (red) and cyp2r1–/– (blue) zebrafish were indicated. VD, vitamin D. |
|
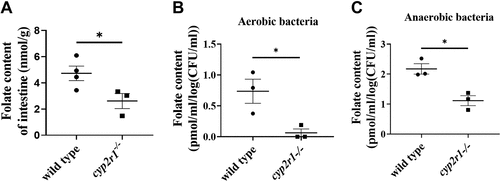
The folate production by gut microbiota in zebrafish was enhanced by VD. A: the folate contents in the intestines of the cyp2r1–/– and wild-type zebrafish. The folate productions by the aerobic bacteria (B) or anaerobic bacteria (C) from the gut microbiota of wild-type or cyp2r1–/– zebrafish were determined. The results are presented as means ± SE (n = 3–4). *P < 0.05. VD, vitamin D PHENOTYPE:
|

