FIGURE SUMMARY
Title

Phosphorylation of Def Regulates Nucleolar p53 Turnover and Cell Cycle Progression through Def Recruitment of Calpain3

Authors
Guan, Y., Huang, D., Chen, F., Gao, C., Tao, T., Shi, H., Zhao, S., Liao, Z., Lo, L.J., Wang, Y., Chen, J., Peng, J.
Source
Full text @ PLoS Biol.

Wild-type p53, but not the mutant p53R175H, is a substrate of CAPN3.

(A) Left panel: the CAPN3 recognition motif. Right panel: upper panel shows the simplified hu-p53 protein with five frequent mutated sites in the DNA-binding domain (DBD) highlighted. Lower panels depict the two putative CAPN3 recognition regions in p53. Numbers denote the position of amino acids in p53. ATG, start codon; TGA, stop codon. (B–D) In vitro assay of p53 degradation by CAPN3 or CAPN3C129S. CAPN3, CAPN3C129S, Myc-hu-Def, Myc-p53, and its mutant derivatives were expressed in 293T cells, respectively. Protein extracts were mixed as indicated and the mixture was incubated in the reaction buffer containing 5 mM CaCl2 at 37°C for 0, 10, 30 min (B), or 30 min (C), or 45 min (D). GAPDH: loading control. Immunodetection of p53 was achieved by using a combination of monoclonal antibodies PAb240 and PAb1620 (B, D), or Anti-Myc tag antibody 9E10 (C). GAPDH was recognised by mouse monoclonal antibody 5-E10 (B) or rabbit monoclonal antibody EPR1977Y (C, D). (E) Left panel: diagram showing the CAPN3-pFastBac plasmid (baculovirus expression system) for transfecting the SF9 cells to express His-CAPN3. Right panel: Coomassie brilliant blue (CBB) staining picture showing total protein crude extract (total crude) and purified His-CAPN3 using the Ni-NTA agarose beads (purified). (F) In vitro assay of the degradation of Myc-p53WT-HA, Myc-p53R248W-HA, or Myc-p53R175H-HA by the purified His-CAPN3 in the presence of 10 mM CaCl2 or 20 mM EDTA as indicated at 37°C for 45 min. GAPDH: loading control. p53 was detected by a combination of monoclonal antibodies PAb240 and Pab1620. GAPDH was recognised by mouse monoclonal antibody 5-E10.

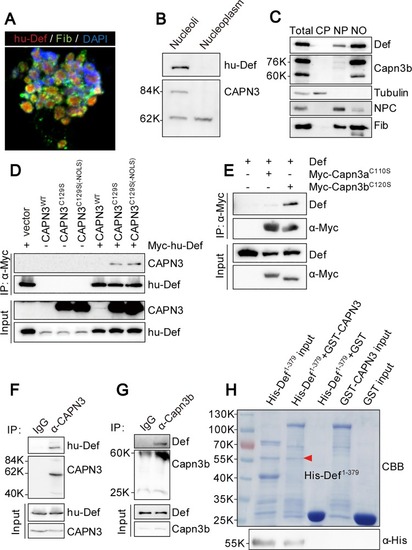
Def directly interacts with CAPN3, and they form a complex in the nucleolus.

(A) Co-immunostaining of the endogenous hu-Def (red), Fib (green), and DAPI (blue) in the isolated nucleoli from the cultured HepG2 cells. (B) Western blot of the endogenous hu-Def and CAPN3 in the nucleoplasmic and nucleolar fractions from HepG2 cells. (C) Western blot of the endogenous Def, Capn3b, Tubulin, NPC, and Fib in different fractions as indicated isolated from the adult wild-type zebrafish liver. CP, cytoplasm; NP, nucleoplasm; NO, nucleoli; NPC, nuclear pore complex. (D) Co-IP of Myc-hu-Def and CAPN3. 293T cells were co-transfected with Myc-hu-Def and wild-type CAPN3 or mutant CAPN3 (CAPN3C129S and CAPN3C129S-ΔNOLS) plasmids. Total protein was extracted at 72 h and incubated with Myc-beads. Antibodies against CAPN3 and hu-Def were used in western blotting. (E) Co-IP of zebrafish Def and Myc-Capn3aC110S or Myc-Capn3bC120S. 293T cells were co-transfected with zebrafish def and Myc-Capn3aC110S or Myc-Capn3bC120S plasmids, respectively. Antibodies against zebrafish Def and the Myc-tag were used in western blotting. (F) Co-IP of the endogenous hu-Def and CAPN3 in HepG2 cells. Total protein extract was incubated with protein A/G agarose beads conjugated with anti-CAPN3 goat polyclonal antibody (COP-080049). CAPN3 was detected by a rabbit polyclonal antibody (No. 38963). (G) Co-IP of the endogenous Def and Capn3b in the isolated adult zebrafish liver nulceoli. Nucleolar protein extract was incubated with protein A/G agarose beads conjugated with anti-Capn3b antibody. (H) Def directly interacts with CAPN3. GST-pulldown was performed by incubating the purified His-Def1-379 with the purified GST, or GST-tagged wild-type CAPN3 immobilised on GST resin. Eluted proteins were stained either with Coomassie blue (CBB) (upper panel) or western blotting using an antibody against the His-tag (lower panel).

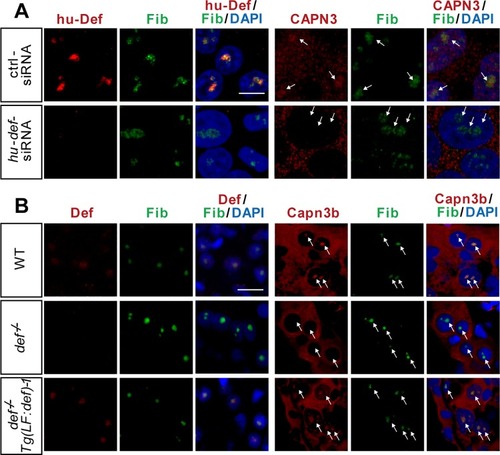
Def determines the nucleolar localisation of Capn3.

(A) Co-immunostaining of the endogenous hu-Def and CAPN3 in 293T cells. Cells were transfected with control siRNA or siRNAs specifically targeting hu-def and cultured for 24 h. (B) Co-immunostaining of the endogenous Def and Capn3b in the liver of 6.5-dpf WT, def-/-, and def-/-Tg(fabp10a:def)-1 (labelled as Tg(LF:def)-1) zebrafish.

Def is phosphorylated at its N-terminus.

(A) Western blot of endogenous Def in protein extracts from 32-hpf embryos treated with (+) or without (-) CIP for 1 h at 37°C. (B) Diagram showing different Def derivatives used in (C, D). (C and D) Western blot to detect Myc-tagged (using anti-Myc antibody) (C) or EGFP-tagged (using anti-EGFP antibody). (D) Def derivatives treated with (+) or without (-) CIP. (E) EGFP-D14 was mixed with EDTA or Na3VO4 prior to addition of CIP. An anti-EGFP antibody was used in western blot. Phos-Tag: Phos-Tag gel for western blot (A, C).

S50, S58, S62, S87, and S92 are modified by phosphorylation.

(A–E) Western blot (using an anti-EGFP antibody) of EGFP-D14 and its various single mutant (A, B), or EGFP-D14 and various double mutant protein derived from EGFP-D14_S50A (C), or EGFP-D14_S50,58,62A triple mutant protein (D), or EGFP-D14_S50,58,62,87,92A penta mutant protein (E) to analyse the gel mobility shift of these EGFP-D14 derivatives treated with (+) or without (-) CIP as shown. (F) Mass spectrum analysis of the EGFP-D14 peptide expressed by 293T cells. S50, S58, and S62 (upper panel), S87 and S92 (lower panel) five serine residues (pS) were identified to be modified by phosphorylation.

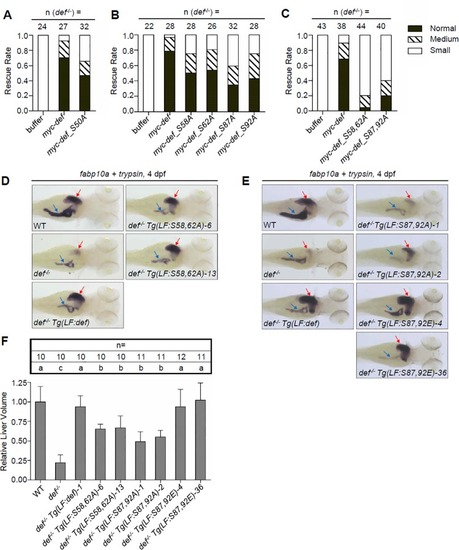
Simultaneous phosphorylations at S58 and S62 or at S87 and S92 are necessary for Def to promote liver development

(A–C) Histogram showing the rescue rate of liver development in def-/- embryos injected with Myc-tagged def and def_S50A(A), def_S58A, def_S62A, def_S87A, and def_S92A(B), or def_S58,62A and def_S87,92A mRNA (C). Injected embryos at 3.5 dpf were examined by WISH using the fabp10a probe (numbers of def-/- embryos examined are shown above the bar), and the sizes of liver were classified into small, medium, and normal three groups. (D, E) WISH analysis of liver (red arrow) and exocrine pancreas (blue arrow) development in different transgenic fishes at 4 dpf using the fabp10a (for liver) and trypsin (for exocrine pancreas) probes simultaneously. (F) Each transgenic fish line was crossed to the reporter line Tg(fabp10a:dsRed; elastase:GFP); background and liver volumes were obtained by 3-D reconstruction of the DsRed signal acquired using a confocal microscope. Total number of embryos used for each genotype was shown above each bar. Data are presented as means with SD. Columns with no common letter are significantly different (p < 0.001, one-way ANOVA with Tukey’s post hoc test). Underlying data for A, B, C, and F are provided in S1 Data.

Simultaneous phosphorylations at S58 and S62 or at S87 and S92 are necessary for Def to promote cell cycle progression.

(A, B) Representative images of P-H3, EdU, and PCNA immunostaining in def-/-Tg(LF:S58,62A)-6 or -13 two lines and relavant control lines (A). Scale bar: 100 μm. Hepatocytes were marked by showing DsRed fluorescence produced by the Tg(fabp10a:dsRed; elastase:GFP) transgenic fish (images for P-H3 and Edu staining) or by an Fabp10a antibody (images for PCNA staining). Nuclei were stained by DAPI. Statistical data for the ratio of P-H3, EdU, and PCNA positive cells in each genotype at 2.5 and 3 dpf were shown, respectively. (B) Data are presented as means with SD. Columns with no common letter are significantly different (p < 0.05, one-way ANOVA with Tukey’s post hoc test). (C) Histogram showing the statistical data for the ratio of P-H3 positive cells in def-/-Tg(LF:S87,92A)-1 or -2 two lines and relavant control lines. Underlying data for B and C are provided in S1 Data.

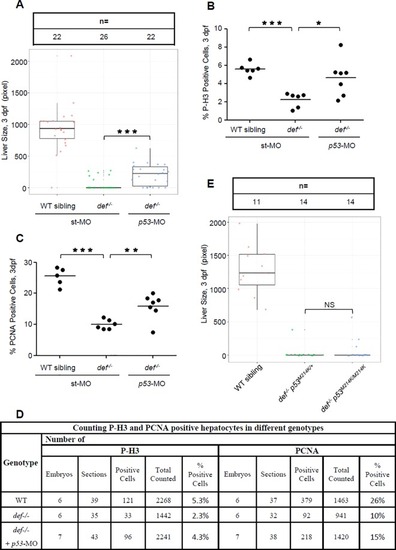
Def phosphorylation modulates its role in cell cycle in zebrafish and knockdown of CAPN3 or Def in cultured human cells causes a p53-dpendent cell cycle arrest.

(A) Histogram showing flow cytometry analysis of the ratio of G1, S, and G2/M phases of liver cells collected from 8-dpf zebrafish of different genotypes as shown. (B) Western blot showing the effect of CAPN3 or hu-Def knockdown on p53 protein level in HCT116-p53+/+ or HCT116-p53-/- cells at 24 h post treatment. β-actin: loading control. (C) Histogram showing flow cytometry analysis of the ratio of cells at G1, S, and G2/M phases in HCT116-p53+/+ (left panel) and HCT116-p53-/- cells (right panel) treated with ctrl-siRNA, capn3-siRNA, or hu-def-siRNA at 24 h post treatment. Data are presented as means with SD. Columns with no common letter are significantly different (p < 0.05). Underlying data for A and C are provided in S1 Data.

Simultaneous phosphorylations at S87 and S92 are necessary for the nucleolar localisation of Capn3b

(A) Co-IP analysis of the interaction between Capn3b and Def, Def_S87,92A, or Def_S87,92E. The 293T cells were transfected with HA-capn3bC120S plasmid alone or in combination with Myc-def, Myc-def_S87,92A, or Myc-def_S87,92E plasmid in three different ratios (HA-capn3b:Myc-defm ratio: 1:1, 1:3, or 1:5), and total protein was extracted 2 d after transfection. Antibodies against the HA-tag (α-HA) or Myc-tag (α-Myc) were used in western blotting. (B, C) Co-immunostaining of the endogenous Def and Capn3b in the liver of 6.5-dpf zebrafish of different genotypes. The percentage of Capn3b-positive cells in different genotypes in (B) was summarized in (C). Nucleoli are indicated by arrows. Scale bar: 10 μm. Underlying data for C are provided in S1 Data.

Simultaneous phosphorylations at S58 and S62 or at S87 and S92 are essential for Def to mediate p53 degradation in the nucleoli.

(A) Co-immunostaining of p53 (in red) and Fib (in green) in different genotypes as shown. DAPI was used to stain the nuclei (blue). Scale bar: 5 μm. (B) Statistical data showing the fold change of p53 signal intensity for hepatocytes versus intestinal epithelial cells in (A). Data are presented as means with SEM. Columns with no common letter are significantly different (p < 0.001, one-way ANOVA with Tukey’s post hoc test). Underlying data for (B) are provided in S1 Data.

Def regulates liver development only in part through the p53 pathway.

(A–D) WISH analysis of liver development (A) and histogram showing the statistical data for the ratio of P-H3- (B) or PCNA- (C) positive cells in def-/- embryos injected with p53-specific morpholino mixes (ATG-MO plus spl-MO) at 3 dpf. Number of embryos used for sectioning and number of sections used for counting P-H3- and PCNA-positive hepatocytes in different genotypes in (B) and (C) was shown in (D). (E) WISH analysis of liver development in the def-/-p53M214K double mutant at 3dpf. The fabp10a probe was used for WISH. Liver size is measured by liver area marked by the fabp10a-positive signal. In the quartile boxplot, each dot represents the liver size of an individual embryo. st-MO, standard control morpholino; ATG-MO, morpholino targeting the translation start site (ATG) of p53; spl-MO, morpholino targeting the splicing junction of exon 5 and intron 5 of p53. In (A) and (E), total number of embryos used for each genotype is shown on the top of the graph. Underlying data for (A), (B), (C), and (E) are provided in S1 Data.

Acknowledgments
This image is the copyrighted work of the attributed author or publisher, and ZFIN has permission only to display this image to its users. Additional permissions should be obtained from the applicable author or publisher of the image. Full text @ PLoS Biol.