
- Title
-
Xanthotoxin, a novel inducer of platelet formation, promotes thrombocytopoiesis via IL-1R1 and MEK/ERK signaling
- Authors
- Lai, J., Li, Y., Ran, M., Huang, Q., Huang, F., Zhu, L., Wu, Y., Zou, W., Xie, X., Tang, Y., Yang, F., Wu, A., Ge, G., Wu, J.
- Source
- Full text @ Biomed. Pharmacother.
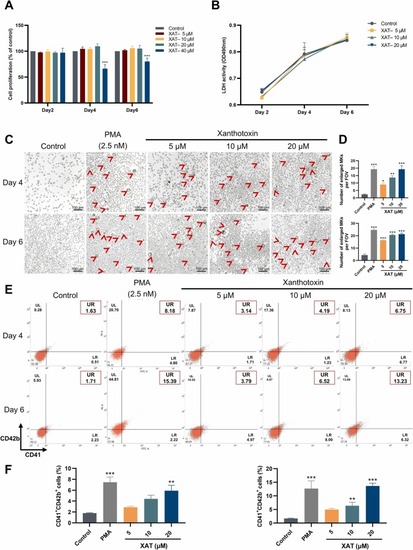
XAT promotes Meg-01 cell differentiation. (A) The proliferation results of Meg-01 cells treated with 5, 10, 20 and 40 µM XAT. F (4,93) = 17.06; *P < .05, **P < .01, ***P < .001, vs control; n = 5–8. (B) LDH release results of Meg-01 cells treated with 5, 10 and 20 µM XAT. F (3,109) = 4.770; *P < .05, **P < .01, ***P < .001, vs control; n = 5–8. (C) Representative images of Meg-01 cells treated with various concentrations of XAT (5, 10 and 20 µM) on the 4th and 6th days. The positive control is PMA (2.5 nM). (D) Count of MK-like cells in the field of view on the 4th (top) and 6th (bottom) days. F (4,10) = 21.68 (top); F (4,10) = 108.5 (bottom); *P < .05, **P < .01, ***P < .001, vs control; n = 3. (E) The expression of CD41 + /CD42b+ in Meg-01 cells was measured on the 4th and 6th days after treatment with 5, 10, and 20 µM of XAT. The positive control was PMA (2.5 nM). (F) The percentage of CD41 + /CD42b+ cells on the 4th (left) and 6th (right) day. F (4,10) = 10.87 (left); F (4,10) = 35.97 (right);*P < .05, **P < .01, ***P < .001, vs control; n = 3. |
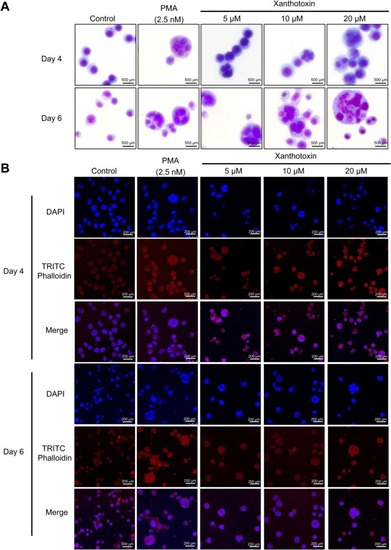
XAT promotes polyploid formation in Meg-01 cells. (A) Giemsa staining of Meg-01 cells treated with XAT (5, 10 and 20 µM). Dark purple represents the nucleus, and light purple represents the cell membrane. The positive control is PMA (2.5 nM). (B) Phalloidin staining of Meg-01 cells treated with XAT (5, 10 and 20 µM). Blue fluorescence represents the nucleus, and red fluorescence represents F-actin. The positive control is PMA (2.5 nM). |
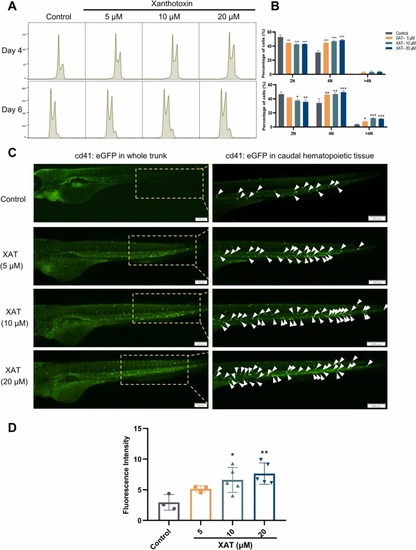
XAT increases the DNA ploidy in Meg-01 cells and thrombopoiesis in zebrafish. (A, B) DNA ploidy changes in XAT-treated Meg-01 cells (5, 10 and 20 µM). The histogram shows the percentage of DNA ploidy in each group. F (3,24) = 3.624 (top); F (3,24) = 2.171 (bottom); *P < .05, **P < .01, ***P < .001, vs control; n = 3. (C, D) Changes in platelet production in zebrafish after XAT administration (5, 10 and 20 µM). The tail regions of zebrafish showed fluorescent spots of platelets, and the histogram represents the fluorescence intensity of platelets. F (3,qw) = 5.555; *P < .05, **P < .01, ***P < .001, vs control; n = 3–5. |
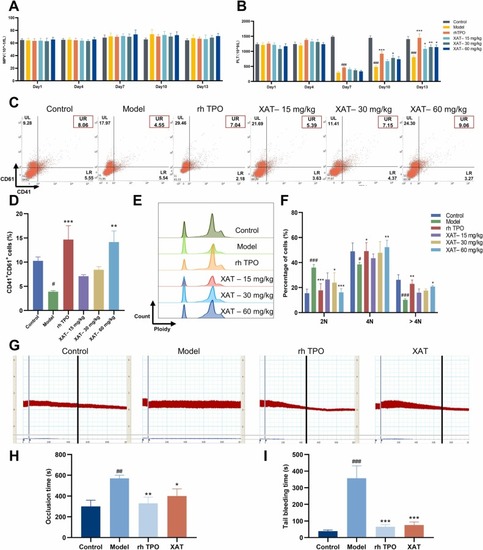
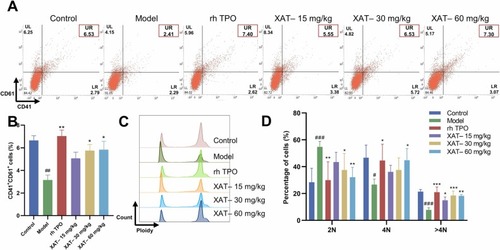
XAT promotes megakaryopoiesis and thrombopoiesis in X-ray-induced thrombocytopenia mice. The effect of XAT on the changes in MPV(A) and PLT (B) in irradiated thrombocytopenia mice on days 1, 4, 7, 10, and 13. F (5.289) = 5.983 (A); F (5.228) = 38.26 (B); *P < .05, **P < .01, ***P < .001, vs model; n = 10–12. ###P < .001, vs control; n = 10–12. (C, D) The expression of CD41 + /CD61 + in BM cells. The histogram shows the proportions of CD41 + /CD61 + cells in each group. F (5,15) = 6.764; *P < .05, **P < .01, ***P < .001, vs model; n = 3. #P < .05, vs control; n = 3. (E, F) DNA ploidy changes in BM CD41 + cells. The histogram shows the percentage of DNA ploidy in CD41 + cells. F (5.36) = 0.2684; *P < .05, **P < .01, ***P < .001, vs model; n = 3. #P < .05, ###P < .001, vs control; n = 3. (G, H) Representative figure of carotid artery thrombosis in each group after 13 days of treatment, and the histogram represents the mean carotid artery occlusion time in each group. F (3,8) = 13.58; *P < .05, **P < .01, ***P < .001, vs model; n = 3. ##P < .01, vs control; n = 3. (I) The tail bleeding time of each group was detected after 13 days of treatment. F (3.39) =149.1; *P < .05, **P <.01, ***P < .001, vs model; n = 3. ###P <.001, vs control; n = 10–12. |
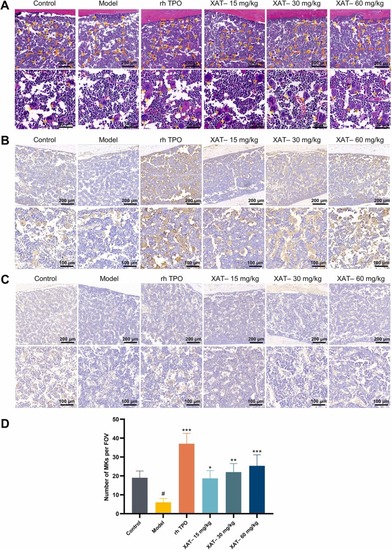
The effects of XAT on BM cells in X-ray-induced thrombocytopenia mice. (A, D) Representative images of H&E staining of BM using a microscope at 200 × (top) and 100 × (bottom) magnification. The yellow arrows indicate megakaryocytes. The histogram shows the number of megakaryocytes randomly selected from three fields in each group. F (5,12) = 15.20; *P < .05, **P < .01, ***P < .001, vs model; n = 3. #P < .05, vs control; n = 3. (B) Immunohistochemical analysis of vWF expression in BM cells from each group. Blue represents the cell nucleus. Brownness represents the expression of vWF. (C) Immunohistochemical analysis of the expression of CD41 in BM cells of each group. Blue represents the cell nucleus. Caramel represents the expression of CD41. |
The effects of XAT on spleen cells in X-ray-induced thrombocytopenia mice. (A, B) The expression of CD41 + /CD61 + in splenocytes. The histogram shows the proportions of CD41 + /CD61 + cells in spleen cells of each group. F (5,12) = 6.267; *P < .05, **P < .01, ***P < .001, vs model; n = 3. ##P < .01, vs control; n = 3. (C, D) DNA ploidy in spleen CD41-positive cells. The histogram represents the percentage of DNA ploidy in each group. F (5.36) = 0.1187; *P < .05, **P < .01, ***P < .001, vs model; n = 3. #P < .05, ###P < .001, vs control; n = 3. |
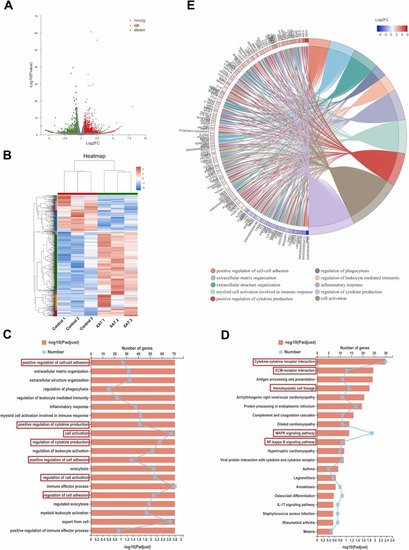
Transcriptome analysis of XAT-regulated gene expression and functional enrichment in DEGs. (A) Volcano plot of DEGs between the control group and XAT treatment group. The red points represent upregulated genes, and the green points represent downregulated genes. (B) Hierarchical clustering analysis of DEGs regulated by XAT. (C) GO enrichment analysis of DEGs. (D) KEGG pathway enrichment analysis of DEGs. (E) GO enrichment chordal graph of DEGs. The larger or smaller the log2FC value, the greater the fold change in gene expression. |
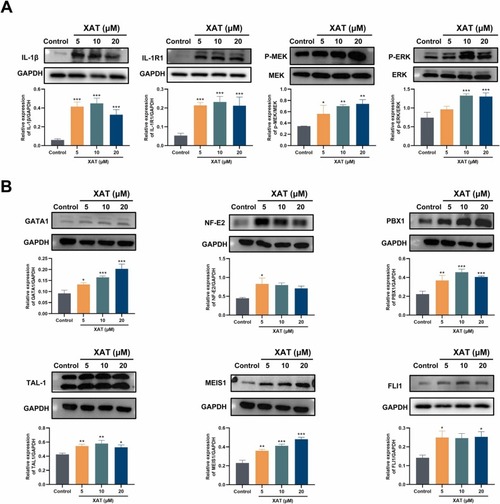
Western blot analysis of signaling pathways and transcription factors induced by XAT. (A) The expression of IL-1 (F (3,8) = 42.69), IL-1R1 (F (3,8) = 24.50), p-ERK (F (3,8) = 24.37) and p-MEK (F (3,8) = 13.13) was detected after Meg-01 cells were treated with XAT (5, 10 and 20 µM) for 4 days. *P < .05, **P < .01, ***P < .001, vs control; n = 3. (B) The expression of transcription factors, including GATA1 (F (3,8) = 25.08), NF-E2 (F (3,8) = 3.793), PBX1 (F (3,8) = 23.60), TAL-1 (F (3,8) = 12.21), MEIS1 (F (3,8) = 23.92) and FLI1 (F (3,8) = 4.298), was detected after Meg-01 cells were treated with XAT (5, 10 and 20 µM) for 4 days. *P < .05, **P < .01, ***P < .001, vs control; n = 3. |
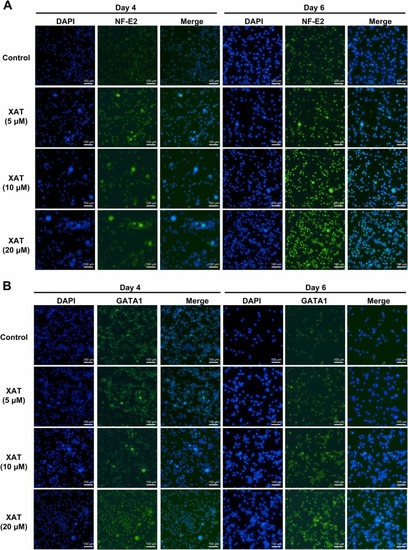
Representative transcription factors regulated by XAT in Meg-01 cells. After treatment with XAT (5, 10 and 20 µM), (A) NF-E2 and (B) GATA1 expression in Meg-01 cells is shown by fluorescence intensity. |
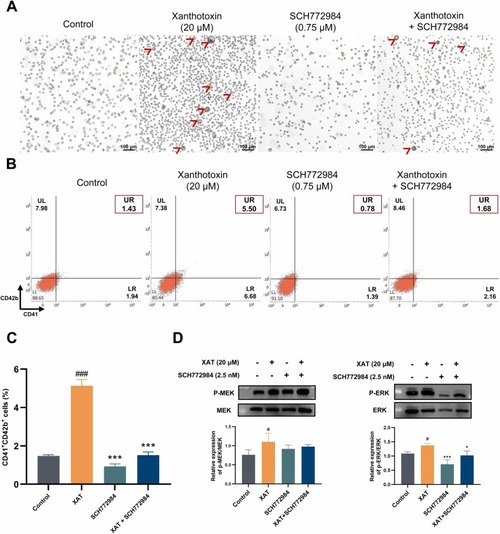
Activation of the MEK/ERK signaling pathway is the underlying mechanism of XAT. Meg-01 cells were treated with XAT (20 μM), XAT (20 μM) + SCH772984 (0.75 μM), or SCH772984 (0.75 μM) for 4 days. (A) Representative images of each group under a microscope. (B, C) FCM analysis of the expression of CD41 and CD42b. The histogram shows the percentage of CD41 + /CD42b+ cells for each group. F (3,8) = 292.2; *P < .05, **P < .01, ***P < .001, vs XAT; n = 3. ###P < .001, vs control; n = 3. (D) The expression of p-MEK (left) and p-ERK (right) was detected by WB. F (3,8) = 3.047 (left); F (3,8) = 15.36 (right); *P < .05, **P < .01, ***P < .001, vs XAT; n = 3. #P < .05, vs control; n = 3. |