FIGURE
            Fig. 7
                
                    
                        Fig. 7


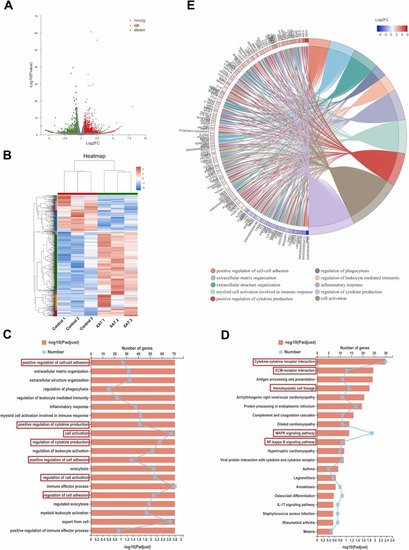
| Transcriptome analysis of XAT-regulated gene expression and functional enrichment in DEGs. (A) Volcano plot of DEGs between the control group and XAT treatment group. The red points represent upregulated genes, and the green points represent downregulated genes. (B) Hierarchical clustering analysis of DEGs regulated by XAT. (C) GO enrichment analysis of DEGs. (D) KEGG pathway enrichment analysis of DEGs. (E) GO enrichment chordal graph of DEGs. The larger or smaller the log2FC value, the greater the fold change in gene expression. | 
                
                    
                        Expression Data


                        Expression Detail


                        Antibody Labeling


                        Phenotype Data


                        Phenotype Detail


                        Acknowledgments


This image is the copyrighted work of the attributed author or publisher, and
ZFIN has permission only to display this image to its users.
Additional permissions should be obtained from the applicable author or publisher of the image.
      Full text @ Biomed. Pharmacother.


        