
Fig. 4
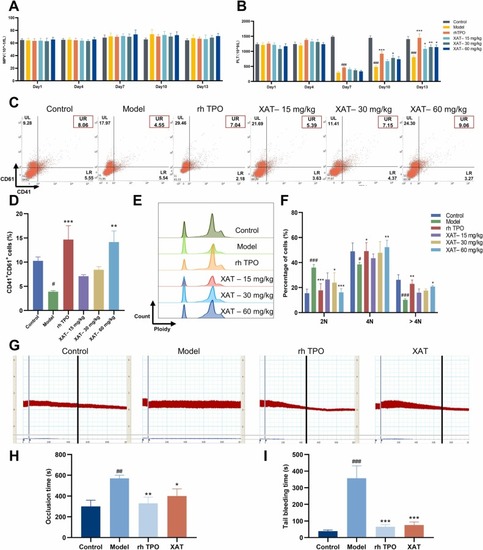
XAT promotes megakaryopoiesis and thrombopoiesis in X-ray-induced thrombocytopenia mice. The effect of XAT on the changes in MPV(A) and PLT (B) in irradiated thrombocytopenia mice on days 1, 4, 7, 10, and 13. F (5.289) = 5.983 (A); F (5.228) = 38.26 (B); *P < .05, **P < .01, ***P < .001, vs model; n = 10–12. ###P < .001, vs control; n = 10–12. (C, D) The expression of CD41 + /CD61 + in BM cells. The histogram shows the proportions of CD41 + /CD61 + cells in each group. F (5,15) = 6.764; *P < .05, **P < .01, ***P < .001, vs model; n = 3. #P < .05, vs control; n = 3. (E, F) DNA ploidy changes in BM CD41 + cells. The histogram shows the percentage of DNA ploidy in CD41 + cells. F (5.36) = 0.2684; *P < .05, **P < .01, ***P < .001, vs model; n = 3. #P < .05, ###P < .001, vs control; n = 3. (G, H) Representative figure of carotid artery thrombosis in each group after 13 days of treatment, and the histogram represents the mean carotid artery occlusion time in each group. F (3,8) = 13.58; *P < .05, **P < .01, ***P < .001, vs model; n = 3. ##P < .01, vs control; n = 3. (I) The tail bleeding time of each group was detected after 13 days of treatment. F (3.39) =149.1; *P < .05, **P <.01, ***P < .001, vs model; n = 3. ###P <.001, vs control; n = 10–12. |