
|
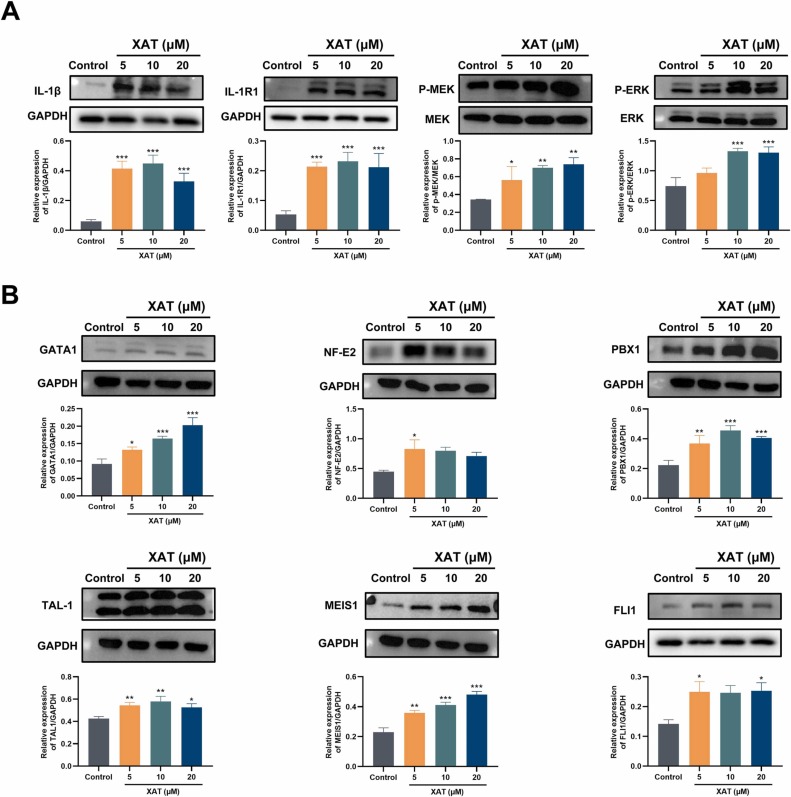
Fig. 8 Western blot analysis of signaling pathways and transcription factors induced by XAT. (A) The expression of IL-1 (F (3,8) = 42.69), IL-1R1 (F (3,8) = 24.50), p-ERK (F (3,8) = 24.37) and p-MEK (F (3,8) = 13.13) was detected after Meg-01 cells were treated with XAT (5, 10 and 20 µM) for 4 days. *P < .05, **P < .01, ***P < .001, vs control; n = 3. (B) The expression of transcription factors, including GATA1 (F (3,8) = 25.08), NF-E2 (F (3,8) = 3.793), PBX1 (F (3,8) = 23.60), TAL-1 (F (3,8) = 12.21), MEIS1 (F (3,8) = 23.92) and FLI1 (F (3,8) = 4.298), was detected after Meg-01 cells were treated with XAT (5, 10 and 20 µM) for 4 days. *P < .05, **P < .01, ***P < .001, vs control; n = 3.