
Fig. 10
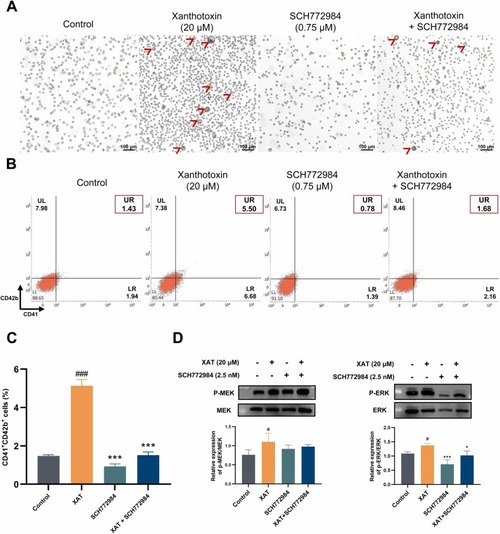
Activation of the MEK/ERK signaling pathway is the underlying mechanism of XAT. Meg-01 cells were treated with XAT (20 μM), XAT (20 μM) + SCH772984 (0.75 μM), or SCH772984 (0.75 μM) for 4 days. (A) Representative images of each group under a microscope. (B, C) FCM analysis of the expression of CD41 and CD42b. The histogram shows the percentage of CD41 + /CD42b+ cells for each group. F (3,8) = 292.2; *P < .05, **P < .01, ***P < .001, vs XAT; n = 3. ###P < .001, vs control; n = 3. (D) The expression of p-MEK (left) and p-ERK (right) was detected by WB. F (3,8) = 3.047 (left); F (3,8) = 15.36 (right); *P < .05, **P < .01, ***P < .001, vs XAT; n = 3. #P < .05, vs control; n = 3. |