
Fig. 1
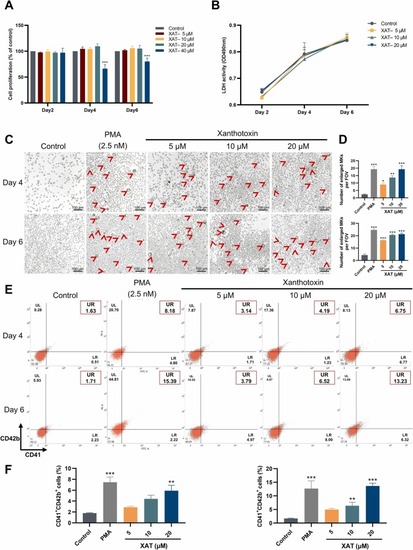
XAT promotes Meg-01 cell differentiation. (A) The proliferation results of Meg-01 cells treated with 5, 10, 20 and 40 µM XAT. F (4,93) = 17.06; *P < .05, **P < .01, ***P < .001, vs control; n = 5–8. (B) LDH release results of Meg-01 cells treated with 5, 10 and 20 µM XAT. F (3,109) = 4.770; *P < .05, **P < .01, ***P < .001, vs control; n = 5–8. (C) Representative images of Meg-01 cells treated with various concentrations of XAT (5, 10 and 20 µM) on the 4th and 6th days. The positive control is PMA (2.5 nM). (D) Count of MK-like cells in the field of view on the 4th (top) and 6th (bottom) days. F (4,10) = 21.68 (top); F (4,10) = 108.5 (bottom); *P < .05, **P < .01, ***P < .001, vs control; n = 3. (E) The expression of CD41 + /CD42b+ in Meg-01 cells was measured on the 4th and 6th days after treatment with 5, 10, and 20 µM of XAT. The positive control was PMA (2.5 nM). (F) The percentage of CD41 + /CD42b+ cells on the 4th (left) and 6th (right) day. F (4,10) = 10.87 (left); F (4,10) = 35.97 (right);*P < .05, **P < .01, ***P < .001, vs control; n = 3. |