
Image
|
Figure Caption
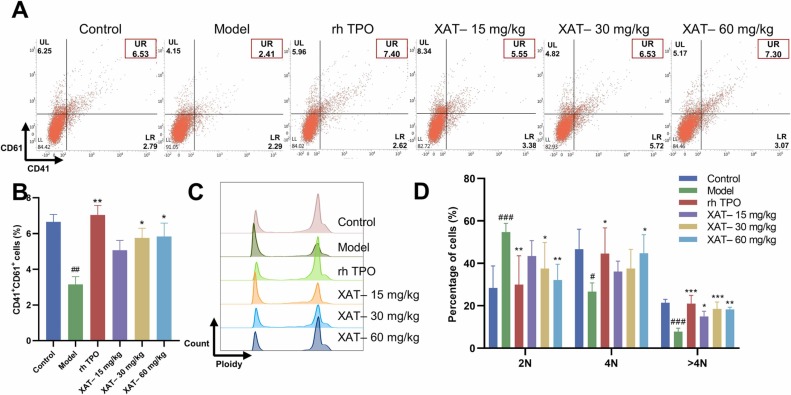
Fig. 6 The effects of XAT on spleen cells in X-ray-induced thrombocytopenia mice. (A, B) The expression of CD41 + /CD61 + in splenocytes. The histogram shows the proportions of CD41 + /CD61 + cells in spleen cells of each group. F (5,12) = 6.267; *P < .05, **P < .01, ***P < .001, vs model; n = 3. ##P < .01, vs control; n = 3. (C, D) DNA ploidy in spleen CD41-positive cells. The histogram represents the percentage of DNA ploidy in each group. F (5.36) = 0.1187; *P < .05, **P < .01, ***P < .001, vs model; n = 3. #P < .05, ###P < .001, vs control; n = 3.
Acknowledgments
This image is the copyrighted work of the attributed author or publisher, and
ZFIN has permission only to display this image to its users.
Additional permissions should be obtained from the applicable author or publisher of the image.
Full text @ Biomed. Pharmacother.