
|
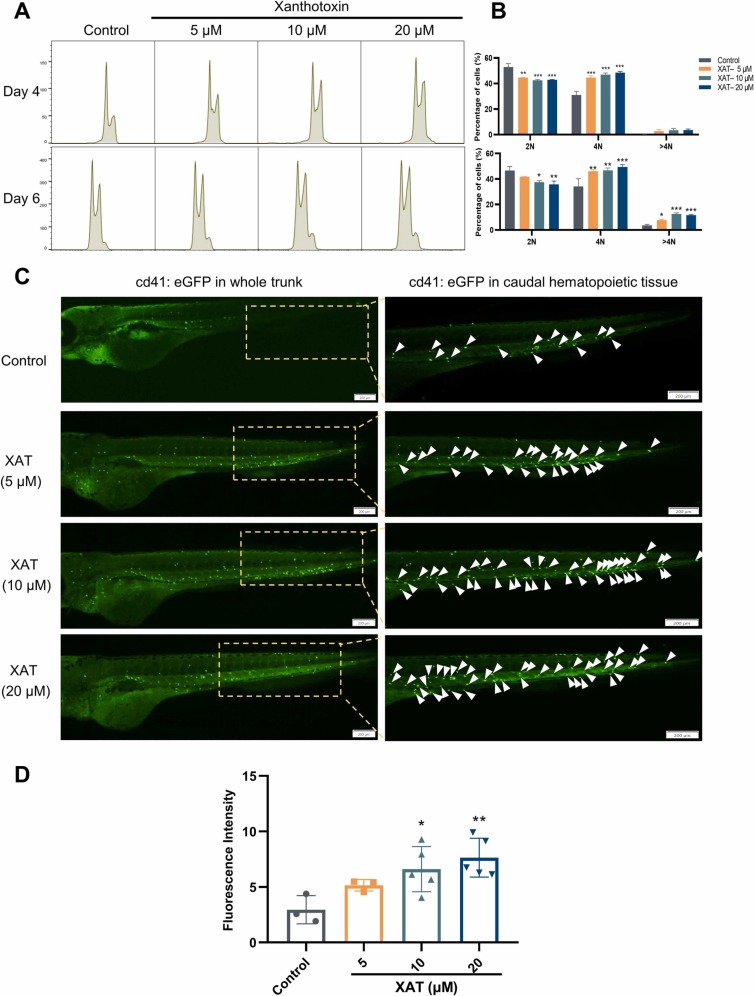
Fig. 3 XAT increases the DNA ploidy in Meg-01 cells and thrombopoiesis in zebrafish. (A, B) DNA ploidy changes in XAT-treated Meg-01 cells (5, 10 and 20 µM). The histogram shows the percentage of DNA ploidy in each group. F (3,24) = 3.624 (top); F (3,24) = 2.171 (bottom); *P < .05, **P < .01, ***P < .001, vs control; n = 3. (C, D) Changes in platelet production in zebrafish after XAT administration (5, 10 and 20 µM). The tail regions of zebrafish showed fluorescent spots of platelets, and the histogram represents the fluorescence intensity of platelets. F (3,qw) = 5.555; *P < .05, **P < .01, ***P < .001, vs control; n = 3–5.