
FIGURE
Fig. 9
Fig. 9
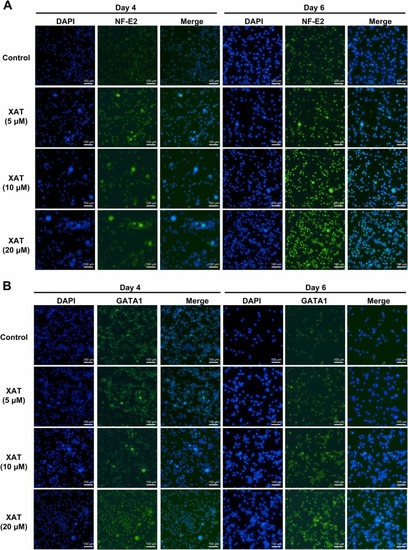
Representative transcription factors regulated by XAT in Meg-01 cells. After treatment with XAT (5, 10 and 20 µM), (A) NF-E2 and (B) GATA1 expression in Meg-01 cells is shown by fluorescence intensity. |
Expression Data
Expression Detail
Antibody Labeling
Phenotype Data
Phenotype Detail
Acknowledgments
This image is the copyrighted work of the attributed author or publisher, and
ZFIN has permission only to display this image to its users.
Additional permissions should be obtained from the applicable author or publisher of the image.
Full text @ Biomed. Pharmacother.