
Fig. 5
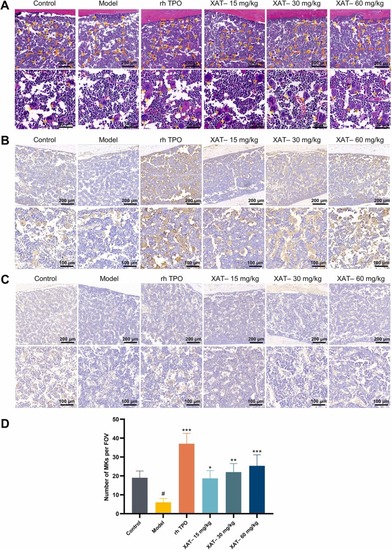
The effects of XAT on BM cells in X-ray-induced thrombocytopenia mice. (A, D) Representative images of H&E staining of BM using a microscope at 200 × (top) and 100 × (bottom) magnification. The yellow arrows indicate megakaryocytes. The histogram shows the number of megakaryocytes randomly selected from three fields in each group. F (5,12) = 15.20; *P < .05, **P < .01, ***P < .001, vs model; n = 3. #P < .05, vs control; n = 3. (B) Immunohistochemical analysis of vWF expression in BM cells from each group. Blue represents the cell nucleus. Brownness represents the expression of vWF. (C) Immunohistochemical analysis of the expression of CD41 in BM cells of each group. Blue represents the cell nucleus. Caramel represents the expression of CD41. |