
- Title
-
Self-transfecting GMO-PMO chimera targeting Nanog enable gene silencing in vitro and suppresses tumor growth in 4T1 allografts in mouse
- Authors
- Das, U., Kundu, J., Shaw, P., Bose, C., Ghosh, A., Gupta, S., Sarkar, S., Bhadra, J., Sinha, S.
- Source
- Full text @ Mol Ther Nucleic Acids
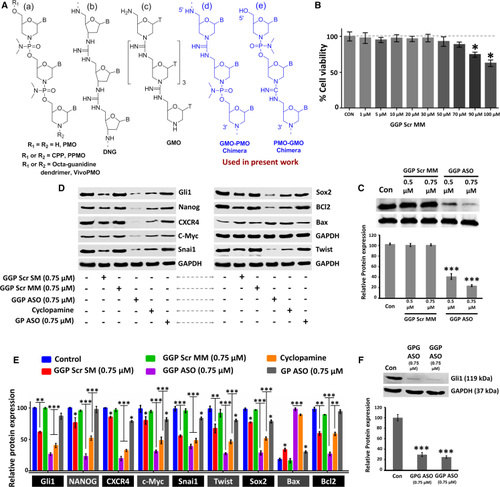
Chemical structures of GMO-PMO, MTT assay and dose dependent Gli1 gene silencing (A) Chemical structures of (a) PMO, PPMO, and vivo PMO; (b) DNG; (c) GMO; (d) GMO-PMO; and (e) PMO-GMO chimeras. (B) Cell viability assay by MTT in Shh Light2 cells after treatment with different doses of GGP Scr MM. (C) Western blot analysis of Gli1 in ShhLight2 cells with different doses of multi-mutated (GGP Scr MM) and Gli1 antisense GMO-PMO (GGP ASO). (D) Comparison of protein repression potential of GGP Scr MM and GGP Scr SM; western blot analysis of the expression of Gli1- and Gli1-related proteins with GGP SCR SM (0.75 μM), GGP SCR MM (0.75 μM), GGP Scr ASO (0.75 μM), GP ASO (0.75 μM), and cyclopamine after 36 h of treatment. The densitometric analysis has been provided along with (E). (F) Western blot analysis of Gli1 at 0.75μM dose of GPG ASO and GGP ASO along with its densitometric analysis. Data presented as mean ± SEM. ∗p < 0.05. |
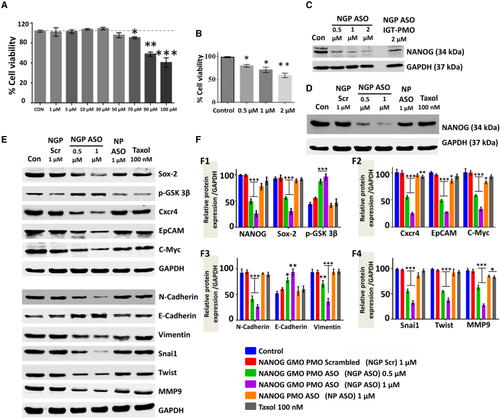
Efficacy of NANOG GMO-PMO ASO in downregulating NANOG and related proteins in MCF7 (A and B) (A) Cell viability assay of MCF7cells after treatment with different doses of NGP Scr and (B) with different doses of NGP ASO. (C) Protein expression of NANOG in MCF7 cells treated with 0.5, 1, and 2 μM NGP ASO compared with that in cells treated with 2 μM NANOG ASO IGT-PMO. (D–F) (D) Comparison among NGP Scr, NGP ASO, NP ASO, and Taxol concerning their effect on the expression of NANOG and NANOG-related proteins (E) in MCF7 along with their densitometric analysis (F). Data presented as mean ± SEM. ∗p < 0.05. |
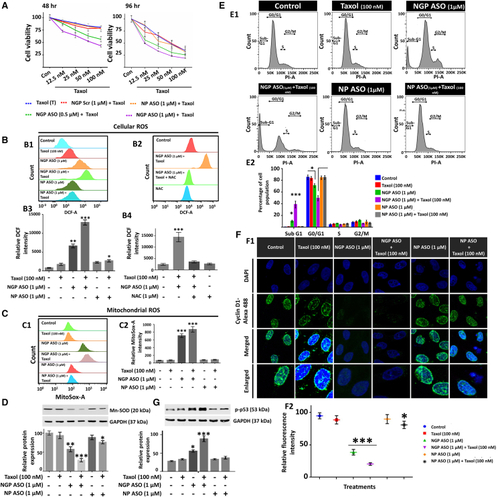
Aggravated chemosensitivity of MCF7 toward Taxol due to NANOG knockdown via NGP ASO in terms of ROS formation and cell-cycle arrest (A) Cell viability assay of MCF7 cells treated with NGP Scr (1 μM), NGP ASO (0.5 and 1 μM), and NP ASO (1 μM) after they were subjected to 12.5, 25, 50, and 100 nM doses of Taxol for 48 and 96 h, respectively. (B and C) The histogram plots (B1 and C1) and respective bar diagrams (B3 and C2) depict potentiation interaction between NGP ASO and Taxol in increasing both cellular and mitochondrial ROS in MCF7. (D) Similar pattern was observed in the downregulation of Mn-SOD, evident through western blot analysis. (E) Representative distribution of MCF7 cells in different phases of the cell cycle as functions of different compound treatments. (F) Immunofluorescence analysis and subsequent confocal microscopy of Cyclin D1 (shown in green) in control and treated cells after 72 h. Nuclei were stained with DAPI (blue) (F1). Quantification of Cyclin D1 intensity per nucleus was calculated for 20–25 cells from confocal images (mean ± SEM). Data are presented as percentages relative to the non-treated MCF-7 cells (F2). (G) Protein expression of p-p53 as obtained from immunoblotting along with its densitometric analysis. Data presented as mean ± SEM. ∗p < 0.05. |
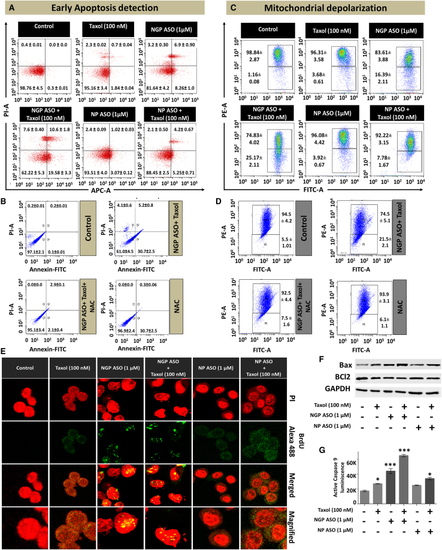
Increased apoptosis due to the combined effect of NANOG suppression and Taxol in MCF7 (A) Representative scattered dot-plot images of flow cytometric analysis show the percentages of MCF-7 cells undergoing necrosis and early and late phases of apoptosis. Here, the lower-left quadrant stands for viable cell population, the lower right quadrant represents the early apoptotic population, the upper right quadrant represents the late apoptotic population, and the upper left quadrant represents the necrotic population. (B) Effect of NAC in Taxol + NGP ASO-treated cells. (C) Change in mitochondrial membrane potential depicted as scattered dot plots after flow cytometric analysis. The upper quadrant shows the cell population with no loss of mitochondrial membrane potential and the lower quadrant shows the cells with loss of membrane potential. (D) Effect of NAC on membrane depolarization of Taxol + NGP ASO-treated cells. (E) Confocal images after BrdU incorporation assay where the nuclei were stained by PI and the incorporation of BrdU was detected by the Alexa 488 tagged (green) anti-BrdU antibody. (F) Western blot analysis of Bax and Bcl2 in Taxol-, NGP ASO-, NGP ASO + Taxol-, NP ASO-, and NP ASO + Taxol-treated MCF7 cells. (G) Bar diagram representing active caspase 9 levels in the above-mentioned treatment groups. Data presented as mean ± SEM. ∗p < 0.05. |

NGP ASO and Taxol synergistically prevent EMT in MCF7 cells (A) Wound-healing assay where the width of wound closure in MCF7 cells at 0 h was set to 100% (A1). (A2) Percentage of wound closure plotted graphically with respect to control. Wound closure was most inhibited in the NGP ASO + Taxol group. (B) Transwell migration assay in MCF7 cells after combined compound treatment at indicated doses (B1). The number of cells that invaded to the lower chamber through Matrigel in the control sample is taken as 100%. (B2) Bar diagram shows the percentage of Transwell migration in MCF-7 cells of treated groups with respect to untreated control. Scale bars, 60 μm. (C) Western blot analysis for expression profiling of EpCAM, Twist, vimentin, MMP9, N-cadherin, and E-cadherin (C1) with their densitometric data (C2). (D) Confocal immunofluorescence microscopic analysis of Snai1 (shown in green) in control and treated cells after 72 h. Nuclei were stained with DAPI (blue). Quantification of Snai1 intensity per nucleus was obtained from confocal immunofluorescence microscopy and was calculated for 20–25 cells. Data presented as mean ± SEM (n = 3). ∗p < 0.05. |
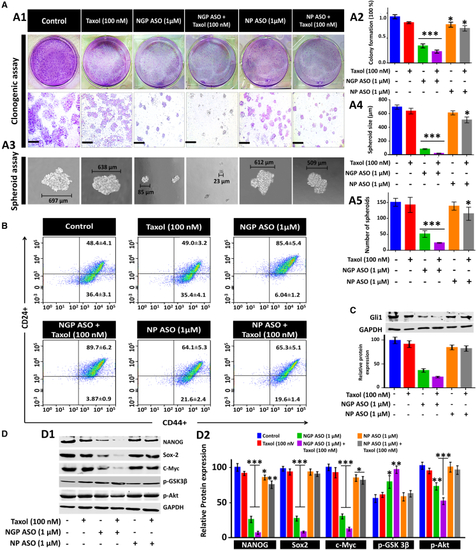
Synergistic effect of NGP ASO and Taxol on the stemness property of MCF7 cells (A) Clonogenic assay; the percentage of cells forming colonies for each compound treatment as indicated are compared, respectively, with that of parental MCF7 cells. Scale bars, 4 μm (A1). (A2) Bar diagram represents the number of colonies with respect to untreated control cells. Spheroid formation assay showing representative microscopic images (A3) of sphere formation for the indicated cell treatments along with bar diagrams depicting the size (A4) and number (A5) of spheroids, respectively. (B) Identification of a CD44+/CD CD24− subpopulation in MCF7 cells by flow cytometry in different experimental treatment groups. (C) Western blot analysis of Gli1 as a function of treatment with Taxol, NGP ASO, NGP ASO + Taxol, NP ASO, and NP ASO + Taxol in MCF7 cells with densitometric analysis. Immunoblot images of NANOG and other related proteins (D1) with their densitometric analysis (D2). Data presented as mean ± SEM. ∗p < 0.05. |
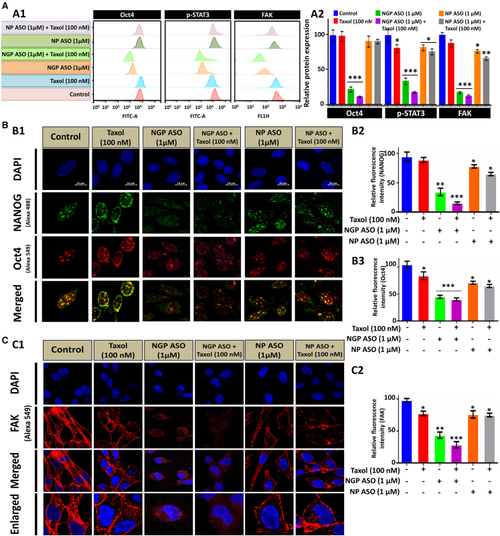
Synergistic effect of NGP ASO and Taxol on the stemness property of MCF7 cells (A) Expression of Oct4, p-STAT3, and FAK detected through flow cytometry analysis in Taxol-, NGP ASO-, NGP ASO + Taxol-, NP ASO-, and NP ASO + Taxol-treated MCF7 cells depicted through histogram (A1) and bar diagrams (A2). (B) Immunofluorescence and confocal microscopic analysis of co-localization of NANOG (green fluorescence) and Oct4 (red fluorescence) in control and other experimental types of treated cells (B1). Nuclei were stained with DAPI (blue fluorescence). Bar diagrams representing relative fluorescence intensity of NANOG (B2) and Oct4 (B3). (C) Confocal images (C1) after immunofluorescence of FAK (red fluorescence) in control and all treatment groups after 36 h with relative fluorescence intensity of FAK. Quantification of NANOG, Oct4, and FAK intensity per nucleus was calculated from confocal images of 20–25 cells each. Data presented as mean ± SEM. ∗p < 0.05. |
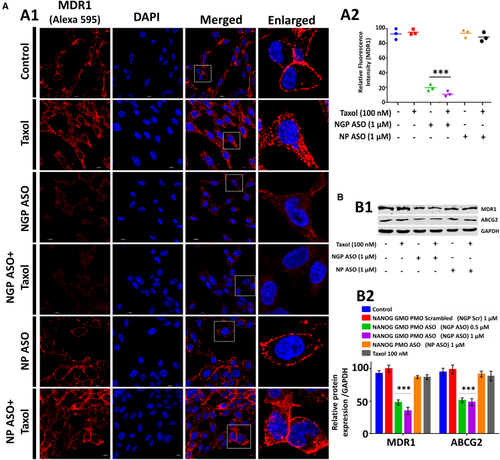
Cause of NGP ASO induced increased chemosensitivity (A) Confocal images after immunofluorescence analysis of MDR1 (shown in red) in control and treated cells after 72 h of combined treatment with antisense and Taxol. Nuclei were stained with DAPI (blue). Quantification of MDR1 intensity per nucleus obtained from confocal immunofluorescence microscopic images (A2) was calculated for 20–25 cells. (B) Western blot analysis reveal MDR1 and ABCG2 downregulation in NGP ASO-treated cells. Data presented as mean ± SEM. ∗p < 0.05. |
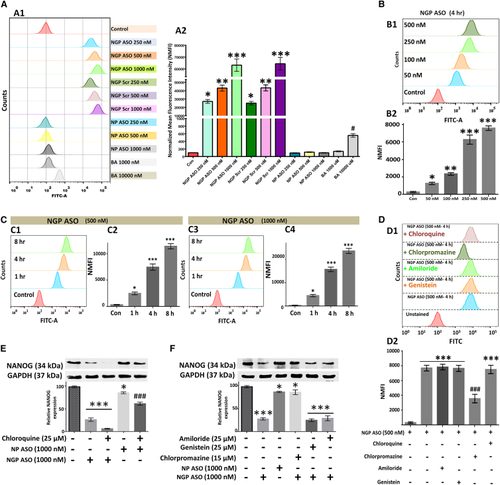
Uptake efficiency and mode of cellular entry (A) Uptake efficiency of NGP ASO, NGP Scr, NP ASO, and Bodipy. (B) NGP ASO shows dose-dependent increase in cellular entry to reach 100% saturation at 50 nM. (C) Time-dependent increase in uptake efficiency; 100% saturation after 1-h exposure duration at both 500 and 1,000 nM. (D) Flow cytometry results of NGP ASO-BODIPY uptake after use of chloroquine, chlorpromazine, amiloride, and genistein. (E) Western blot analysis of NANOG in MCF7 cells after treatment with NGP ASO/NPASO alone and in combination with chloroquine. (F) Immunoblot analysis of NANOG in MCF7 cells after treatment with NGP ASO/NPASO alone and in combination with amiloride, genistein, and chlorpromazine. Data presented as mean ± SEM. ∗p < 0.05. |
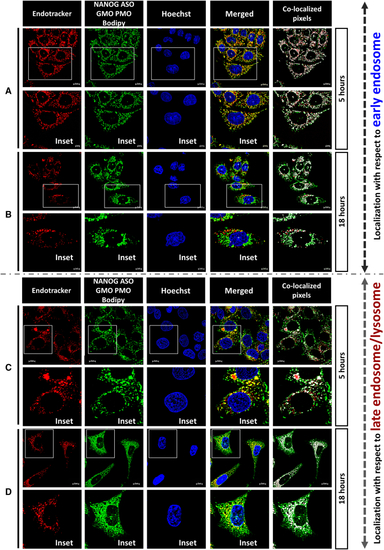
Intracellular localization of NGP ASO (A and B) Localization of NGP ASO concerning early endosome after (A) 5- and (B) 18-h incubation. (C and D) Localization of NGP ASO concerning late endosome/lysosome after (C) 5- and (D) 18-h incubation. |
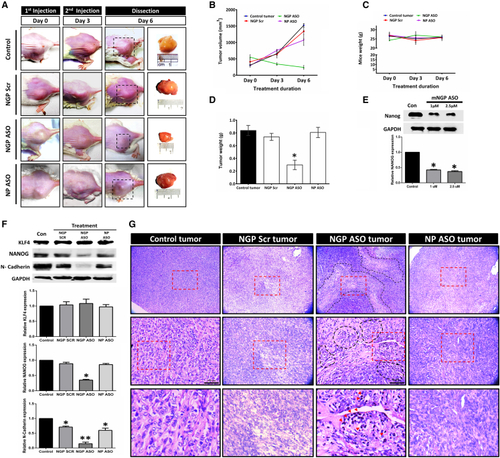
Effect of mNGP ASO in 4T1 mice allografts (A) Representative images depicting the formation and growth of tumor in Balb/c mice; right-most panel contains representative images of intact tumors subsequent to dissection. (B) Graphical representation of changes in tumor volume with time in different groups. (C) Graph representing BW of mice in all treatment groups across experiment duration. (D) Bar diagram representing weight of tumors after dissection. (E) Western blot analysis of NANOG in mice 4T1 cell line following treatment with mNGP ASO at 1 and 2 μM treatment concentration. (F) Western blot analysis of KLF4, NANOG, and N-cadherin from 4T1 allograft tumor after 6 days of intratumoral treatment (5 mg/kg BW; twice in 6 days at interval of 3 days) with mNGP Scr, mNGP ASO, and mNP ASO. (G) Histological images of tumor from untreated mice and mice treated with mNGP Scr, mNGP ASO, and mNP ASO. The red dotted boxes represent the area that is demonstrated in magnification in the following row. Regions lined with dotted black line indicate areas with necrotic tissue. Red arrowheads in the lowest panel depict cells with pycnotic nuclei. Data presented as mean ± SEM. ∗p < 0.05. |