
|
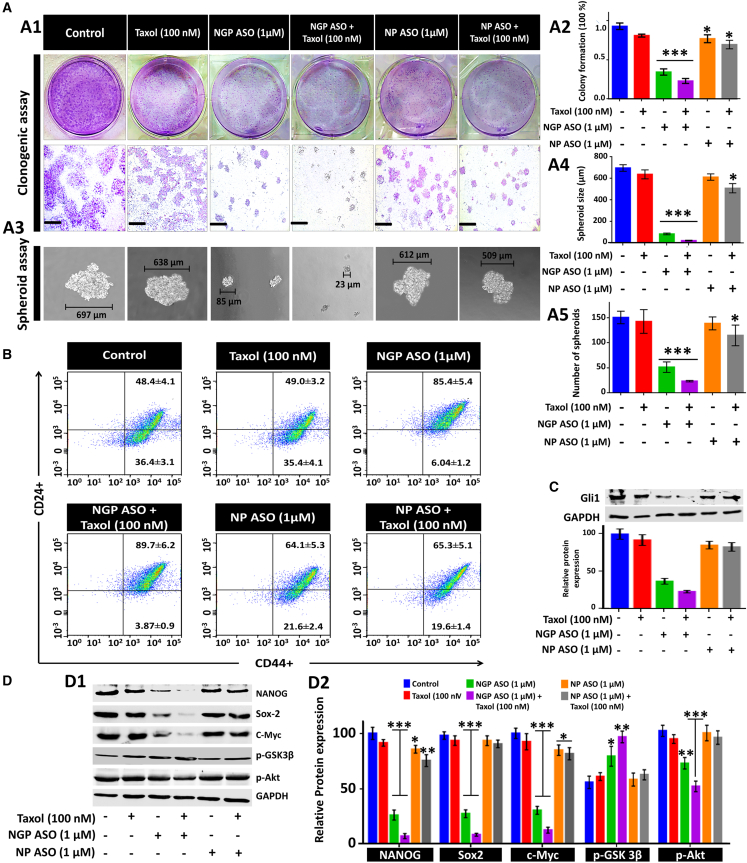
Fig. 6
Synergistic effect of NGP ASO and Taxol on the stemness property of MCF7 cells
(A) Clonogenic assay; the percentage of cells forming colonies for each compound treatment as indicated are compared, respectively, with that of parental MCF7 cells. Scale bars, 4 μm (A1). (A2) Bar diagram represents the number of colonies with respect to untreated control cells. Spheroid formation assay showing representative microscopic images (A3) of sphere formation for the indicated cell treatments along with bar diagrams depicting the size (A4) and number (A5) of spheroids, respectively. (B) Identification of a CD44+/CD CD24− subpopulation in MCF7 cells by flow cytometry in different experimental treatment groups. (C) Western blot analysis of Gli1 as a function of treatment with Taxol, NGP ASO, NGP ASO + Taxol, NP ASO, and NP ASO + Taxol in MCF7 cells with densitometric analysis. Immunoblot images of NANOG and other related proteins (D1) with their densitometric analysis (D2). Data presented as mean ± SEM. ∗p < 0.05.