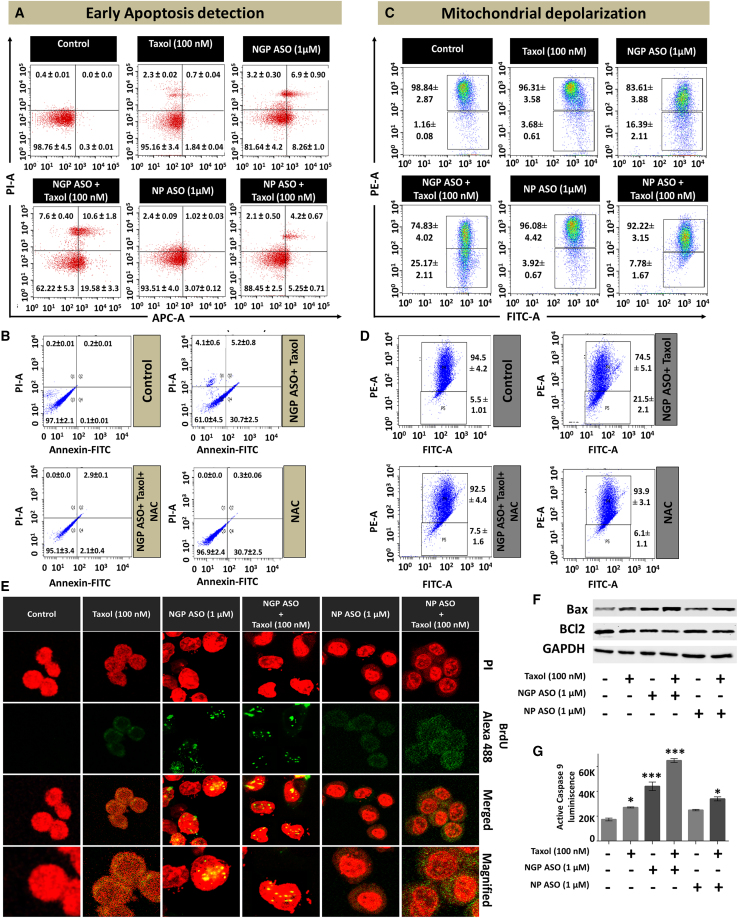
Fig. 4
Increased apoptosis due to the combined effect of NANOG suppression and Taxol in MCF7
(A) Representative scattered dot-plot images of flow cytometric analysis show the percentages of MCF-7 cells undergoing necrosis and early and late phases of apoptosis. Here, the lower-left quadrant stands for viable cell population, the lower right quadrant represents the early apoptotic population, the upper right quadrant represents the late apoptotic population, and the upper left quadrant represents the necrotic population. (B) Effect of NAC in Taxol + NGP ASO-treated cells. (C) Change in mitochondrial membrane potential depicted as scattered dot plots after flow cytometric analysis. The upper quadrant shows the cell population with no loss of mitochondrial membrane potential and the lower quadrant shows the cells with loss of membrane potential. (D) Effect of NAC on membrane depolarization of Taxol + NGP ASO-treated cells. (E) Confocal images after BrdU incorporation assay where the nuclei were stained by PI and the incorporation of BrdU was detected by the Alexa 488 tagged (green) anti-BrdU antibody. (F) Western blot analysis of Bax and Bcl2 in Taxol-, NGP ASO-, NGP ASO + Taxol-, NP ASO-, and NP ASO + Taxol-treated MCF7 cells. (G) Bar diagram representing active caspase 9 levels in the above-mentioned treatment groups. Data presented as mean ± SEM. ∗p < 0.05.

