
|
Fig. 3
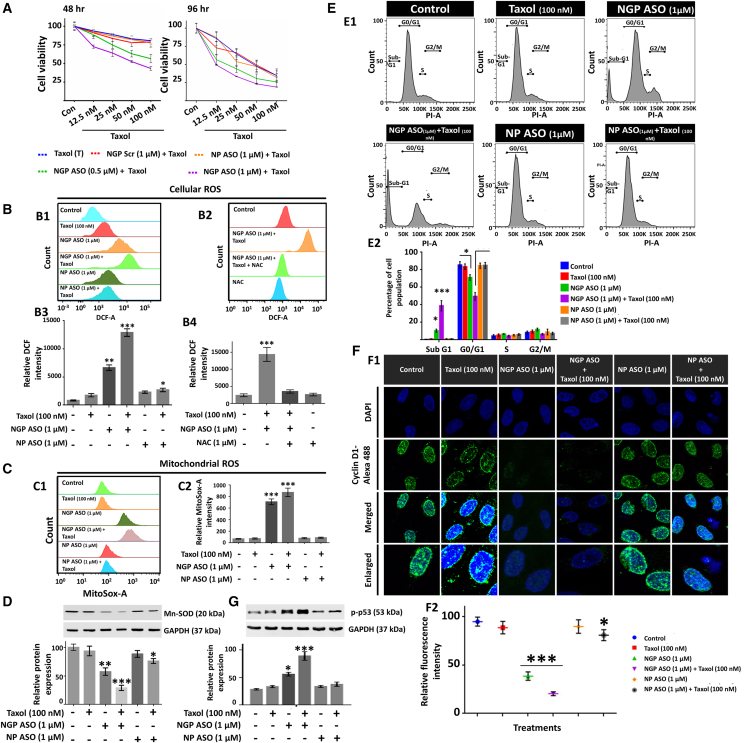
Aggravated chemosensitivity of MCF7 toward Taxol due to NANOG knockdown via NGP ASO in terms of ROS formation and cell-cycle arrest
(A) Cell viability assay of MCF7 cells treated with NGP Scr (1 μM), NGP ASO (0.5 and 1 μM), and NP ASO (1 μM) after they were subjected to 12.5, 25, 50, and 100 nM doses of Taxol for 48 and 96 h, respectively. (B and C) The histogram plots (B1 and C1) and respective bar diagrams (B3 and C2) depict potentiation interaction between NGP ASO and Taxol in increasing both cellular and mitochondrial ROS in MCF7. (D) Similar pattern was observed in the downregulation of Mn-SOD, evident through western blot analysis. (E) Representative distribution of MCF7 cells in different phases of the cell cycle as functions of different compound treatments. (F) Immunofluorescence analysis and subsequent confocal microscopy of Cyclin D1 (shown in green) in control and treated cells after 72 h. Nuclei were stained with DAPI (blue) (F1). Quantification of Cyclin D1 intensity per nucleus was calculated for 20–25 cells from confocal images (mean ± SEM). Data are presented as percentages relative to the non-treated MCF-7 cells (F2). (G) Protein expression of p-p53 as obtained from immunoblotting along with its densitometric analysis. Data presented as mean ± SEM. ∗p < 0.05.