
Image
|
Figure Caption
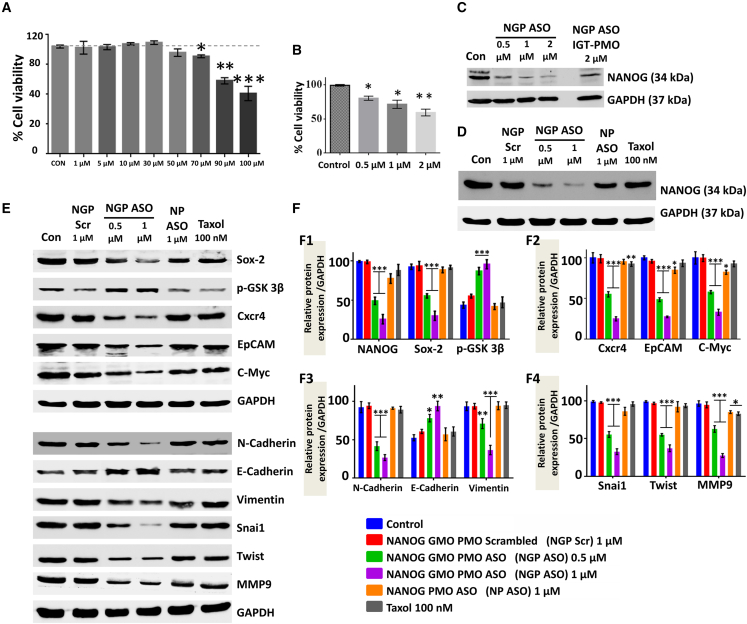
Fig. 2
Efficacy of NANOG GMO-PMO ASO in downregulating NANOG and related proteins in MCF7
(A and B) (A) Cell viability assay of MCF7cells after treatment with different doses of NGP Scr and (B) with different doses of NGP ASO. (C) Protein expression of NANOG in MCF7 cells treated with 0.5, 1, and 2 μM NGP ASO compared with that in cells treated with 2 μM NANOG ASO IGT-PMO. (D–F) (D) Comparison among NGP Scr, NGP ASO, NP ASO, and Taxol concerning their effect on the expression of NANOG and NANOG-related proteins (E) in MCF7 along with their densitometric analysis (F). Data presented as mean ± SEM. ∗p < 0.05.
Acknowledgments
This image is the copyrighted work of the attributed author or publisher, and
ZFIN has permission only to display this image to its users.
Additional permissions should be obtained from the applicable author or publisher of the image.
Full text @ Mol Ther Nucleic Acids