
Fig. 11
- ID
- ZDB-FIG-230911-11
- Publication
- Das et al., 2023 - Self-transfecting GMO-PMO chimera targeting Nanog enable gene silencing in vitro and suppresses tumor growth in 4T1 allografts in mouse
- Other Figures
- All Figure Page
- Back to All Figure Page
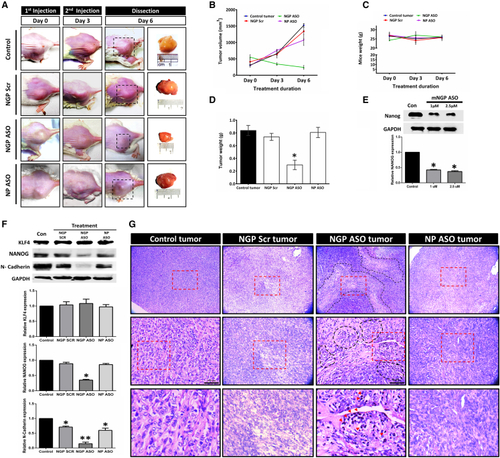
Effect of mNGP ASO in 4T1 mice allografts (A) Representative images depicting the formation and growth of tumor in Balb/c mice; right-most panel contains representative images of intact tumors subsequent to dissection. (B) Graphical representation of changes in tumor volume with time in different groups. (C) Graph representing BW of mice in all treatment groups across experiment duration. (D) Bar diagram representing weight of tumors after dissection. (E) Western blot analysis of NANOG in mice 4T1 cell line following treatment with mNGP ASO at 1 and 2 μM treatment concentration. (F) Western blot analysis of KLF4, NANOG, and N-cadherin from 4T1 allograft tumor after 6 days of intratumoral treatment (5 mg/kg BW; twice in 6 days at interval of 3 days) with mNGP Scr, mNGP ASO, and mNP ASO. (G) Histological images of tumor from untreated mice and mice treated with mNGP Scr, mNGP ASO, and mNP ASO. The red dotted boxes represent the area that is demonstrated in magnification in the following row. Regions lined with dotted black line indicate areas with necrotic tissue. Red arrowheads in the lowest panel depict cells with pycnotic nuclei. Data presented as mean ± SEM. ∗p < 0.05. |