
- Title
-
Loxhd1b inhibits the hair cell development in zebrafish: Possible relation to the BDNF/TrkB/ERK pathway
- Authors
- Liu, J., Zhang, X., Zhang, Q., Wang, R., Ma, J., Bai, X., Wang, D.
- Source
- Full text @ Front. Cell. Neurosci.
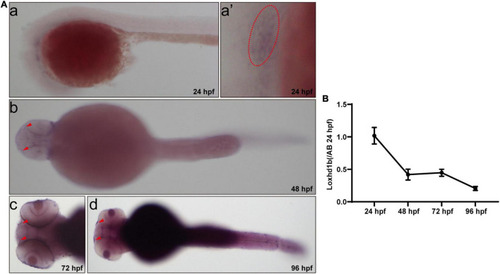
Expression of Loxhd1b in zebrafish. (A) In situ hybridization revealing the Loxhd1b expression around the otic vesicles and Olfactory hole, indicating its contribution to hearing development. The arrows indicate the olfactory hole. The ellipse of dashed line indicates the otic vesicle. (B) Loxhd1b expression gradually decreased from 24 to 96 hpf. |

Effect of Loxhd1b knockdown on decreasing the number of hair cells in the otic vesicle and posterior lateral line of zebrafish. (A) The targeting site of Loxhd1b splice blocking morpholino and the PCR primer design for validating the knockdown analysis. The wild type mature transcripts indicate the natural splicing product of Loxhd1b mRNA. The splicing MO mature transcripts indicate the abnormal splicing product of Loxhd1b mRNA with Exon 2 deletion caused by morpholino injection. (B) Effectiveness of Loxhd1b knockdown confirmed by PCR. (C) The schematic for three clusters of cristae hair cells in the otic vesicle. ACHC, anterior cristae hair cells; LCHC, lateral cristae hair cells; PCHC, posterior cristae hair cells. (D) Fluorescence microscopic imaging analysis of Loxhd1b knockdown line at 3 dpf. Arrowheads indicate hair cell clusters. Scale bar = 500 μm. (E) Confocal imaging analysis of cristae hair cells in the otic vesicle of control and Loxhd1b deficiency zebrafish at 72 and 96 hpf. Scale bar = 50 μm. (F) WISH experiments of the eya1 gene and the imaging analysis of control, claudin h morphants, and rescued zebrafish at 96 hpf in bright field. Scale bar = 500 μm. (G) Statistical analysis of zebrafish lateral line neuromast at 72 hpf. (H) Statistics of zebrafish lateral line neuromasts at 96 hpf. (I) Statistical analysis of the number of different cristae hair cells in the inner ear of control and Loxhd1b-MO in 72 hpf. (J) Statistical analysis of the number of different cristae hair cells in the inner ear of control and Loxhd1b-MO in 96 hpf. (K) C-startle response in Loxhd1b morphants zebrafish larvae was significantly lower than that in control zebrafish. **P < 0.01, ***P < 0.001, and ****P < 0.0001. PHENOTYPE:
|
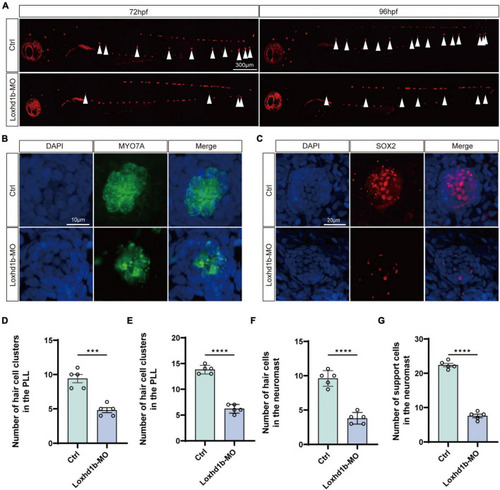
Morphology and number of hair cells and support cells in Loxhd1b-knockdown and control zebrafish. (A) Reduced numbers of neuromast hair cells in Loxhd1b-morphant fish labeled by FM1-43FX at 72 and 96 hpf. The arrows point to the position of posterior lateral line neuromasts. Scale bar = 300 μm. (B,C) Immunostaining of zebrafish lateral line hair cells and support cells at 72 hpf. Hair cells are stained with myosin-7a antibody and support cells were stained with SOX2 antibody. Scale bar = 10 and 20 μm. (D–G) Statistical analysis of the hair cell clusters in control and Loxhd1b-morphan based on t-test. ***P < 0.001 and ****P < 0.0001. EXPRESSION / LABELING:
PHENOTYPE:
|
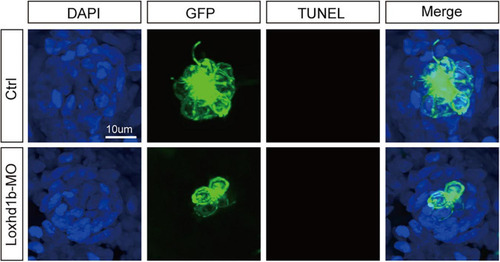
TUNEL cell apoptosis experiment in 72 dpf Loxhd1b knockdown zebrafish, showing that no apoptosis signal is detected. Scale bar = 10 μm. |
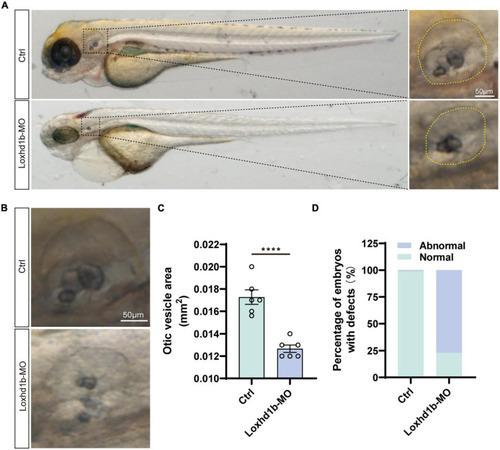
Loss of function of Loxhd1b causes the defects of otic vesicle and otoliths. (A,B) Imaging analysis of otic vesicle in control and Loxhd1b knockdown at 72 hpf. The yellow dotted line marks the boundary of the otic vesicle. Scale bar = 50 μm. (C) Statistical analysis of otic vesicle area in the control and Loxhd1b morphants at 72 hpf. (D) The Loxhd1b morphants with the utricle otolith lost, showing the decrease in number and defects in shape of otoliths, i.e., the Loxhd1b morphants showing either the utricle otolith lost or an abnormal saccular otolith. ****P < 0.0001. PHENOTYPE:
|

BDNF/TrkB/ERK signaling pathway regulated by the Loxhd1b gene in zebrafish auditory development. (A) Clustering analysis showing the replicates within group with a sound repeatability, while the control and mutated group are different in the clustering. (B) Volcano diagram of differentially expressed genes. Red and blue dots indicate up-regulated and down-regulated genes, respectively. Abscissa indicates gene fold change in different samples; ordinate represents statistical significance of gene expression change. (C) KEGG analysis of the differentially expressed genes. The vertical and horizontal axes represent the pathways and the Rich factor, respectively. The size of the dot indicates proportionally the number of differentially expressed genes in the pathway, and the color of the dot corresponds to a different Q value range. (D–H) Detection of protein expression of Loxhd1b, BDNF, TrkB, P-TrkB, ERK, and P-ERK based on chemiluminescence imaging system. ***P < 0.001 and ****P < 0.0001. |
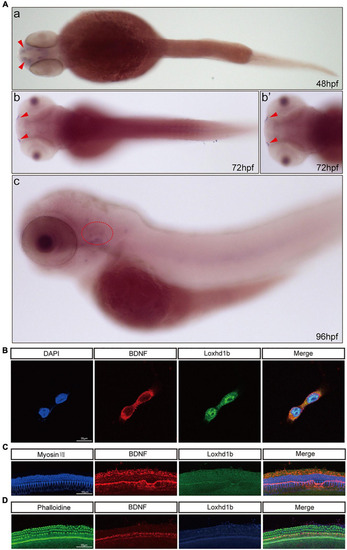
Co-localization of Loxhd1b and BDNF. (A) In situ hybridization at 48–96 hpf showing that BDNF is expressed around the inner ear and olfactory pore of zebrafish, suggesting the effect of BDNF on hearing development. The red arrow indicates the olfactory pore of the zebrafish, and the red dotted circle indicates the inner ear of the zebrafish. (B) Immunofluorescence staining of Loxhd1b and BDNF in HEI-OC1 cells. The nuclei are stained blue by DAPI. Scale bar = 35 μm. (C) Representative images of inner ear hair cells in cochleae from C57 mice of 7 days old. The inner ear hair cells are labeled with Myosin VII (blue). Scale bar = 55 μm. (D) Representative images of inner ear hair cells in cochleae from p57 mice of 7 days old. Phalloidin is used to label the inner ear hair cells (green). Scale bar = 55 μm. |
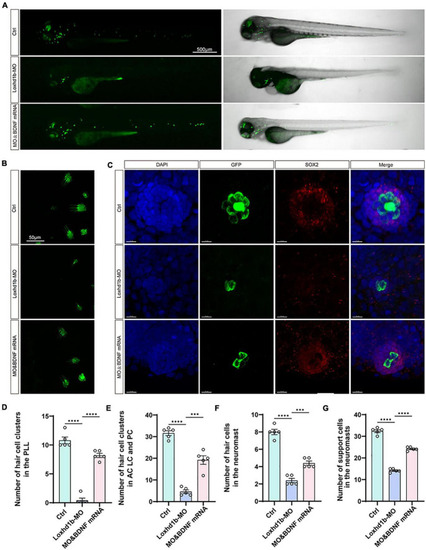
The developmental defects of hair cells in Loxhd1b morphants rescued by BDNF mRNA. (A) Imaging analysis of control, Loxhd1b morphants, and rescued zebrafish at 72 hpf in bright field (right) and fluorescent field (left). Scale bar = 500 μm. (B) Imaging analysis of cristae hair cells in control, Loxhd1b morphants, and rescue group at 72 hpf. Scale bar = 50 μm. (C) Imaging analysis of support cells in control, Loxhd1b morphants, and rescue group at 72 hpf. Scale bar = 50 μm. (D) Quantification of the number of hair cell clusters in the posterior lateral line of different groups at 72 hpf. (E–G) Statistical analysis of the number of different hair cells and support cells in different groups at 72 hpf. ***P < 0.001 and ****P < 0.0001. PHENOTYPE:
|

Loss of function of Loxhd1b causing the defects of otic vesicle and otoliths. (A) Imaging analysis of otic vesicle and cristae hair cells in control, Loxhd1b morphants, and rescue group at 96 hpf. The yellow dotted line marks the boundary of the otic vesicle. Scale bar = 50 μm. (B) BDNF mRNA is effective to rescue the reduced number of otoliths and smaller size of otic vesicle caused by Loxhd1b MO. Scale bar = 50 μm. (C) Statistical analysis of otic vesicle area in different groups at 96 hpf. (D) Proportions of embryos with developmental defects at 72 dpf. *P < 0.05 and ***P < 0.001. PHENOTYPE:
|