
Image
|
Figure Caption
FIGURE 5
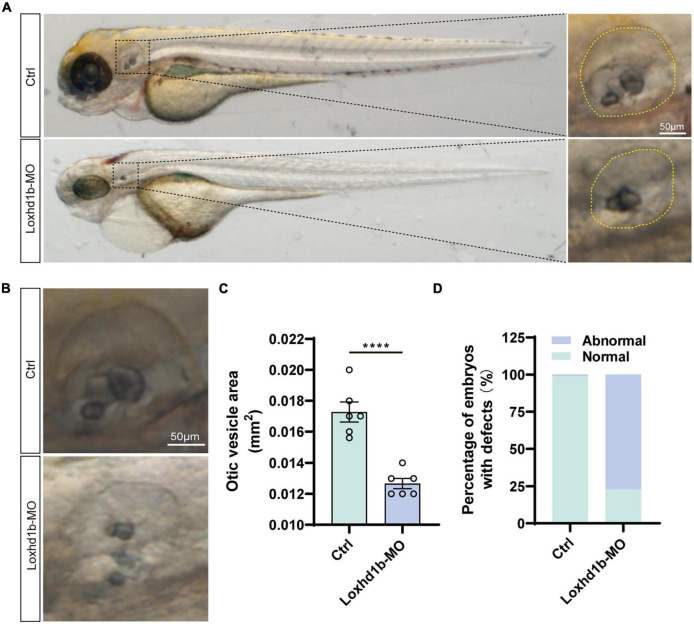
Loss of function of Loxhd1b causes the defects of otic vesicle and otoliths. (A,B) Imaging analysis of otic vesicle in control and Loxhd1b knockdown at 72 hpf. The yellow dotted line marks the boundary of the otic vesicle. Scale bar = 50 μm. (C) Statistical analysis of otic vesicle area in the control and Loxhd1b morphants at 72 hpf. (D) The Loxhd1b morphants with the utricle otolith lost, showing the decrease in number and defects in shape of otoliths, i.e., the Loxhd1b morphants showing either the utricle otolith lost or an abnormal saccular otolith. ****P < 0.0001.
Figure Data
Acknowledgments
This image is the copyrighted work of the attributed author or publisher, and
ZFIN has permission only to display this image to its users.
Additional permissions should be obtained from the applicable author or publisher of the image.
Full text @ Front. Cell. Neurosci.