
|
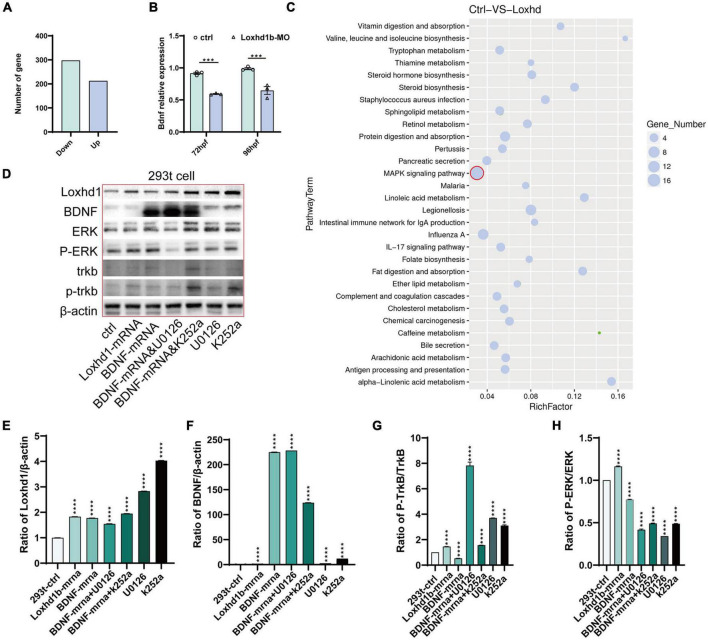
FIGURE 6
BDNF/TrkB/ERK signaling pathway regulated by the Loxhd1b gene in zebrafish auditory development. (A) Clustering analysis showing the replicates within group with a sound repeatability, while the control and mutated group are different in the clustering. (B) Volcano diagram of differentially expressed genes. Red and blue dots indicate up-regulated and down-regulated genes, respectively. Abscissa indicates gene fold change in different samples; ordinate represents statistical significance of gene expression change. (C) KEGG analysis of the differentially expressed genes. The vertical and horizontal axes represent the pathways and the Rich factor, respectively. The size of the dot indicates proportionally the number of differentially expressed genes in the pathway, and the color of the dot corresponds to a different Q value range. (D–H) Detection of protein expression of Loxhd1b, BDNF, TrkB, P-TrkB, ERK, and P-ERK based on chemiluminescence imaging system. ***P < 0.001 and ****P < 0.0001.