
- Title
-
Gsx2, but not Gsx1, is necessary for early forebrain patterning and long-term survival in zebrafish
- Authors
- Coltogirone, R.A., Sherfinski, E.I., Dobler, Z.A., Peterson, S.N., Andlinger, A.R., Fadel, L.C., Patrick, R.L., Bergeron, S.A.
- Source
- Full text @ Dev. Dyn.

Gsx1 and Gsx2 are conserved across vertebrates and expressed in zebrafish from embryonic stages through adulthood. (A) Amino acid sequence alignment of zebrafish, mouse, and human Gsx1 and Gsx2. Dr, Danio rerio; Mm, Mus musculus; Hs, Homo sapiens. Identical amino acids are shaded in black, similar amino acids are shaded in gray, and the region encoding the conserved DNA-binding homeodomain is underlined in orange. (B) Rooted phylogenetic tree displaying the clustered relationship of published Gsx1 and Gsx2 protein sequences as well as a divergence from the Drosophila ortholog Ind. Values represent distance scores. Dm, Drosophila melanogaster; Lo, Lepisosteus oculatus; Ol, Oryzias latipes; Xt, Xenopus tropicalis. (C) Schematic of the zebrafish gsx1 and gsx2 gene bodies. Blue boxes represent exons, black lines represent introns, and orange boxes represent the region encoding the homeodomain. Red arrowheads represent RT-PCR primer annealing sites. (D) Agarose gels showing full-length cDNA transcripts of zebrafish gsx1 (top), gsx2 (middle), and ef1a (bottom) at specific ages. Red text indicates ladder sizes. Upper bands in the gsx1 gel image represents trace genomic DNA that includes the 89 bp intron |

Expression of gsx1 and gsx2 in embryonic zebrafish is dynamic and unique. (A-G) Lateral mounts showing expression of gsx1 from 12 to 48 hpf. (H-N) Lateral mounts showing expression of gsx2 from 12 to 48 hpf. (O-R) Dorsal (O and Q) and ventral (P and R) mounts showing expression of gsx1 from 30 to 48 hpf. (S-V) Dorsal (S and U) and ventral (T and V) mounts showing expression of gsx2 from 30 to 48 hpf. A, B, H, and I are dissecting scope images and scale bar represents 500 μm. Remaining images are compound scope images taken at ×20 with samples mounted under cover glass and anterior facing left, eyes removed in lateral views. Scale bars represent 100 μm. CeP, cerebellar plate; Di, diencephalon; Fb, forebrain; Hb, hindbrain; Hyp, hypothalamus; Mb, midbrain; OB, olfactory bulb; P, pallium; Po, preoptic area; Pr, pretectum; Sc, spinal cord; Tel, telencephalon; TeO, optic tectum EXPRESSION / LABELING:
|
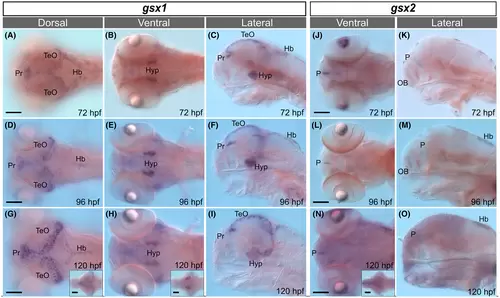
Expression of gsx1 and gsx2 is restricted in late embryonic and early larval stages. (A-I) Expression of gsx1 from 72 to 120 hpf. Leftmost column are dorsal views, middle column are ventral views, and rightmost column are lateral views. (J-O) Expression of gsx2 from 72 to 120 hpf. Left column are dorsal views and rightmost column are lateral views. All images are compound scope images taken at ×20 with samples mounted under cover glass and anterior facing left, eyes removed in lateral views. Scale bars represent 100 μm. Insets are whole brain dissections at the same age mounted dorsally. Hb, hindbrain; Hyp, hypothalamus; OB, olfactory bulb; P, pallium; Pr, pretectum; TeO, optic tectum EXPRESSION / LABELING:
|
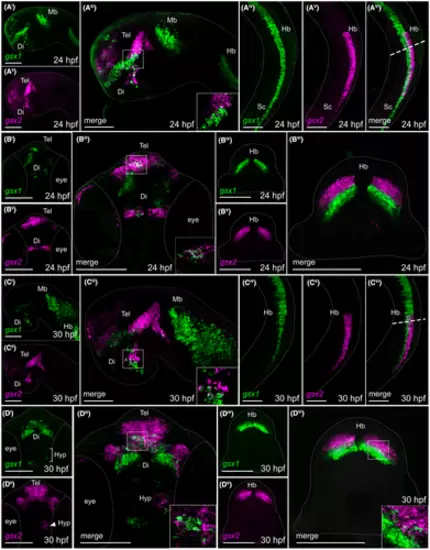
Fluorescence in situ hybridization confirms minimal co-localization of gsx1 and gsx2 during embryonic development. (Ai-Avi) Lateral views of gsx1 and gsx2 expression at 24 hpf. (Bi-Biii) Ventral view of gsx1 and gsx2 expression at 24 hpf. (Biv-Bvi) Cross-sectional view taken at the dashed line in Avi. (Ci-Cvi) Lateral views of gsx1 and gsx2 expression at 30 hpf. (Di-Diii) Ventral view of gsx1 and gsx2 expression at 30 hpf. (Div-Dvi) Cross-sectional view taken at the dashed line in Cvi. Lateral views were taken at ×20 and ventral/Cross-sectional views were taken at ×40, all with anterior facing left. All were pseudocolored using FIJI ImageJ and scale bars represent 100 μm. For lateral views, eyes were dissected off. Main images are max z-projections and insets are single z-stack slices zoomed into the boxed region shown in the main image. Di, diencephalon; Hb, hindbrain; Mb, midbrain; Sc, spinal cord; Tel, telencephalon |
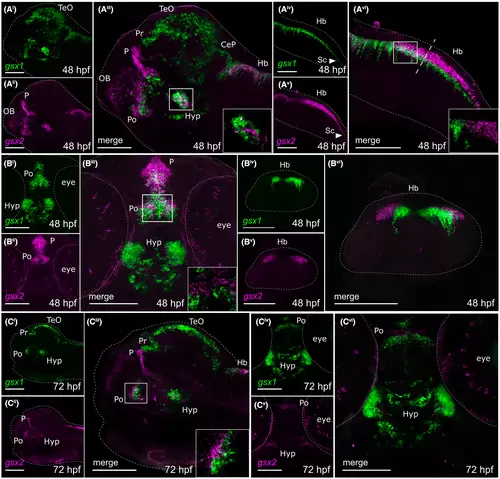
Fluorescence in situ hybridization confirms minimal co-localization of gsx1 and gsx2 during late embryonic and early larval development. (Ai-Avi) Lateral views showing expression of gsx1 and gsx2 at 48 hpf. (Bi-Bii) Ventral views showing expression of gsx1 and gsx2 at 48 hpf. (Biv-Bvi) Cross-sectional view taken at the dashed line in Avi. (Ci-Ciii) Lateral view showing gsx1 and gsx2 expression at 72 hpf. (Civ-Cvi) Ventral view showing gsx1 and gsx2 expression at 72 hpf. Lateral views were taken at ×20 and ventral/Cross-sectional views were taken at ×40, all with anterior facing left. All were pseudocolored using FIJI ImageJ and scale bars represent 100 μm. For lateral views, eyes were dissected off. Main images are max z-projections and insets are single z-stack slices zoomed into the boxed region shown in the main image. CeP, cerebellar plate; Di, diencephalon; Hb, hindbrain; Hyp, hypothalamus; Mb, midbrain; OB, olfactory bulb; P, pallium; Po, preoptic area; Pr, pretectum; Sc, spinal cord; Tel, telencephalon; TeO, optic tectum EXPRESSION / LABELING:
|
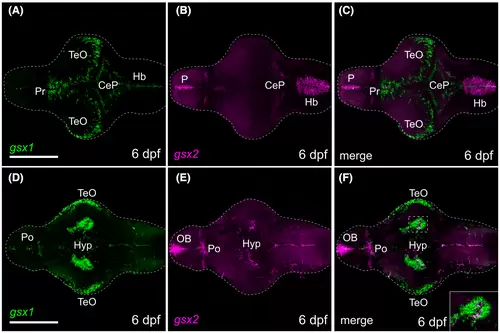
gsx1 and gsx2 are expressed through 6 dpf in the brain. (A-C) Dorsal views showing expression of gsx1 and gsx2 at 6 dpf. (D-F) Ventral views showing expression of gsx1 and gsx2 at 6 dpf. Images taken at ×20 with anterior facing left. All were pseudocolored using FIJI ImageJ and scale bars represent 100 μm. Main images are max z-projections and insets are single z-stack slices zoomed into the boxed region shown in the main image. Hb, hindbrain; Hyp, hypothalamus; OB, olfactory bulb; P, pallium; Po, preoptic area; Pr, pretectum; Tel, telencephalon; TeO, optic tectum EXPRESSION / LABELING:
|
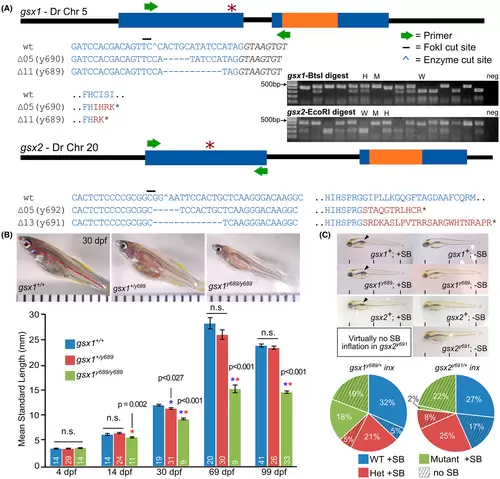
gsx1 TALEN mutants experience stunted growth and gsx2 TALEN mutants experience swim bladder inflation failure. (A) Schematic of the gsx1 and gsx2 gene bodies and targeted TALEN mutation site (red *). All mutations should result in a premature stop codon. Text color corresponds with gene body structure (blue = exon, black = intron, orange = homeodomain, red = mutant sequence). Inset gel shows restriction digest of gsx1 and gsx2 amplicons in wild type (W), heterozygous (H), and mutant (M) individuals; endonuclease cutting is disrupted in mutants. (B) Comparison of the standard length (SL, red line) of gsx1+/+, gsx1+/y689, and gsx1y689/y689 siblings at 30 dpf. Images are dissecting scope images and distances between black tick marks represent 1 mm. Graph shows the quantification of long-term growth study data from 4 to 99 dpf. Asterisks indicate significant differences between that group and the genotype with the same color asterisk (blue bar, wild type; red bar, heterozygote; green bar, mutant). (C) Top, comparisons of gsx1+/+, gsx1+/y689, and gsx1y689/y689 siblings and gsx2+/+, gsx2+/y691, and gsx2y691/y691 siblings with (+SB) and without (−SB) swim bladders, respectively; bottom, quantification of the percentage of larvae of each genotype with and without swim bladders (gsx1 n = 73 siblings, gsx2 n = 60 siblings) |
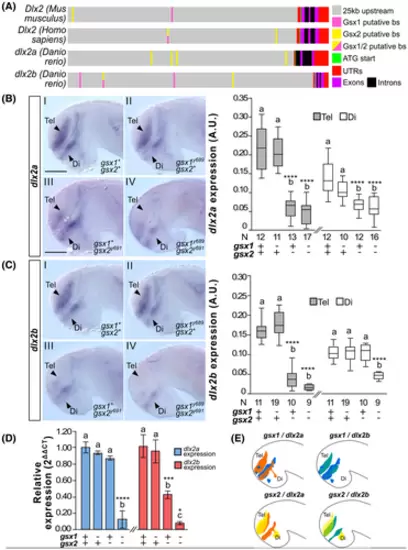
Gsx1 and Gsx2 differentially regulate dlx2a and dlx2b expression. (A) Schematic of Gsx1 and 2 putative binding sites (putative bs) in the Dlx2 orthologs. (B) Left, dlx2a expression at 30 hpf in wild type, gsx1y689, gsx2y691, and gsx1y689;gsx2y691 zebrafish. Images are ×20 compound scope images with samples mounted under cover glass, eyes dissected, and anterior facing left. Scale bar = 50 μm. Right, FIJI-ImageJ quantification of dlx2a expression in the telencephalon (gray bars) and diencephalon (white bars). Genotypes and sample size are listed under the x-axis. Different letters represent significant differences. (C) Left, dlx2b expression at 30 hpf in wild type, gsx1y689, gsx2y691, and gsx1y689;gsx2y691 zebrafish; right, quantification of dlx2b expression. (D) RT-qPCR data showing relative expression of dlx2a (blue bars) and dlx2b (red bars) in wild type, gsx1y689, gsx2y691, and gsx1y689;gsx2y691 zebrafish compared to the reference gene ef1a. Different letters indicate significant differences within each target gene. Asterisks correspond with P-values; *P < .05, **P < .01, ***P < .005, ****P < .001. (E) Schematics of gsx1, gsx2, dlx2a, and dlx2b expression at 30 hpf |
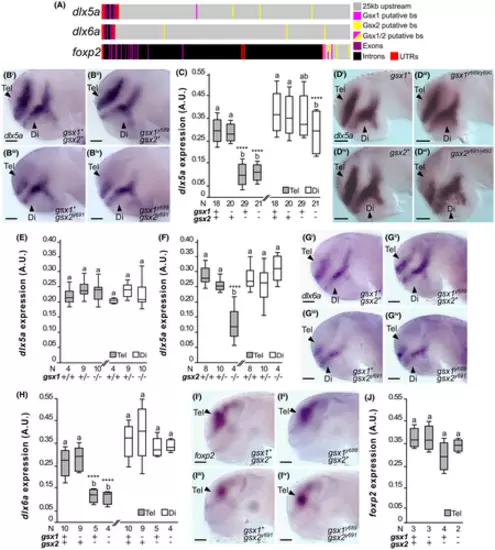
Regulation of dlx5a, dlx6a, and foxp2 by Gsx1 and Gsx2. (A) Schematic of Gsx1 and 2 putative binding sites (putative bs) upstream of the zebrafish dlx5a, dlx6a, and foxp2 gene bodies. (Bi-Biv) dlx5a expression at 30 hpf in wild type, gsx1y689, gsx2y691, and gsx1y689;gsx2y691 zebrafish. Images are ×20 compound scope images with samples mounted under cover glass, eyes dissected, and anterior facing left. Scale bar = 50 μm. (C) Quantification of dlx5a expression from experiment shown in (B) panels. Sample sizes for all FIJI-ImageJ analyses are indicated. Different letters represent significant differences and asterisks correspond with P-values; *P < .05, **P < .01, ***P < .005, ****P < .001. (Di-Div) dlx5a expression at 30 hpf in wild type, gsx1y689/y690 mutants and gsx2y691/y692 mutants. (E). Quantification of dlx5a expression in gsx1y689/y690 mutants experiment in (D) panels. (F) FIJI-ImageJ quantification of dlx5a expression in gsx2y691/y692 mutants experiment shown in (D) panels. (G) dlx6a expression at 30 hpf in wild type, gsx1y689, gsx2y691, and gsx1y689;gsx2y691 zebrafish. (H) Quantification of dlx6a expression in (G) panels. (Ii-Iiv) foxp2 expression at 30 hpf in wild type, gsx1y689, gsx2y691, and gsx1y689;gsx2y691 zebrafish. (J) Quantification of foxp2 expression in (I) panels experiment |
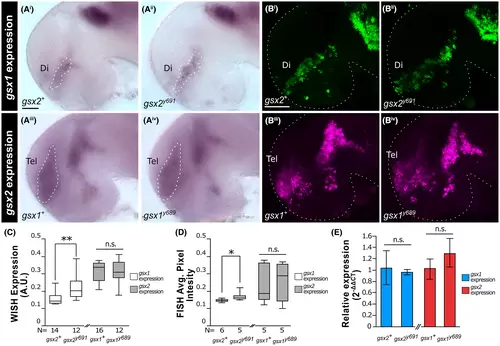
gsx1 and gsx2 expression in gsx1 and gsx2 mutant zebrafish. (Ai-Aiv) whole-mount in situ hybridization (WISH) images at 30 hpf showing gsx1 expression in wild-type and gsx2y691 embryos (top) and gsx2 expression in wild-type and gsx1y689 embryos. Images are ×20 compound scope images with embryos mounted under cover glass, eyes dissected, and anterior facing left. (Bi-Biv) FISH images at 30 hpf. Images are ×20 confocal images with embryos mounted under cover glass, eyes dissected, and anterior facing left. (C) FIJI-ImageJ quantification of images in (Ai-Aiv). (D) FIJI-ImageJ quantification of images in (Bi-Biv). Sample sizes for all FIJI-ImageJ analyses are indicated. Asterisks indicate significant differences and correspond with P-values; *P < .05, **P < .01, ***P < .005, ****P < .001. (E) RT-qPCR quantification of gsx1 and gsx2 expression in 30 hpf embryos across genotypes. The 2−∆∆Ct method was used to calculate relative expression to the reference gene ef1a. Data are representative of two biological replicates (parent groups) |