
Fig. 8
- ID
- ZDB-IMAGE-230807-8
- Genes
- Publication
- Coltogirone et al., 2022 - Gsx2, but not Gsx1, is necessary for early forebrain patterning and long-term survival in zebrafish
- All Figures
- Figures for Coltogirone et al., 2022
|
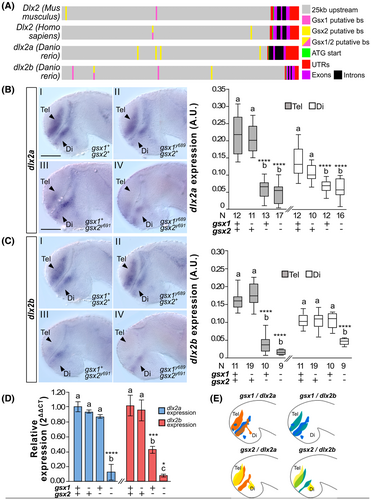
Fig. 8 Gsx1 and Gsx2 differentially regulate dlx2a and dlx2b expression. (A) Schematic of Gsx1 and 2 putative binding sites (putative bs) in the Dlx2 orthologs. (B) Left, dlx2a expression at 30 hpf in wild type, gsx1y689, gsx2y691, and gsx1y689;gsx2y691 zebrafish. Images are ×20 compound scope images with samples mounted under cover glass, eyes dissected, and anterior facing left. Scale bar = 50 μm. Right, FIJI-ImageJ quantification of dlx2a expression in the telencephalon (gray bars) and diencephalon (white bars). Genotypes and sample size are listed under the x-axis. Different letters represent significant differences. (C) Left, dlx2b expression at 30 hpf in wild type, gsx1y689, gsx2y691, and gsx1y689;gsx2y691 zebrafish; right, quantification of dlx2b expression. (D) RT-qPCR data showing relative expression of dlx2a (blue bars) and dlx2b (red bars) in wild type, gsx1y689, gsx2y691, and gsx1y689;gsx2y691 zebrafish compared to the reference gene ef1a. Different letters indicate significant differences within each target gene. Asterisks correspond with P-values; *P < .05, **P < .01, ***P < .005, ****P < .001. (E) Schematics of gsx1, gsx2, dlx2a, and dlx2b expression at 30 hpf