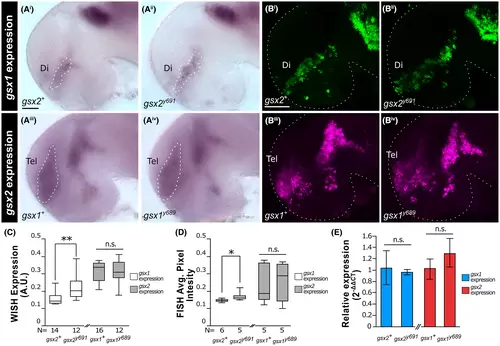
gsx1 and gsx2 expression in gsx1 and gsx2 mutant zebrafish. (Ai-Aiv) whole-mount in situ hybridization (WISH) images at 30 hpf showing gsx1 expression in wild-type and gsx2y691 embryos (top) and gsx2 expression in wild-type and gsx1y689 embryos. Images are ×20 compound scope images with embryos mounted under cover glass, eyes dissected, and anterior facing left. (Bi-Biv) FISH images at 30 hpf. Images are ×20 confocal images with embryos mounted under cover glass, eyes dissected, and anterior facing left. (C) FIJI-ImageJ quantification of images in (Ai-Aiv). (D) FIJI-ImageJ quantification of images in (Bi-Biv). Sample sizes for all FIJI-ImageJ analyses are indicated. Asterisks indicate significant differences and correspond with P-values; *P < .05, **P < .01, ***P < .005, ****P < .001. (E) RT-qPCR quantification of gsx1 and gsx2 expression in 30 hpf embryos across genotypes. The 2−∆∆Ct method was used to calculate relative expression to the reference gene ef1a. Data are representative of two biological replicates (parent groups)
|
