
- Title
-
Aminomethanesulfonic acid illuminates the boundary between full and partial agonists of the pentameric glycine receptor
- Authors
- Ivica, J., Zhu, H., Lape, R., Gouaux, E., Sivilotti, L.G.
- Source
- Full text @ Elife
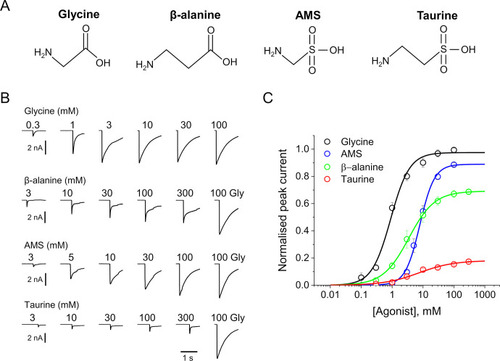
(A) Structures of glycine, β-alanine, AMS, and taurine. (B) Whole-cell current responses of HEK293 cells elicited by application of agonist solutions (pH 5) with a U-tube. Cells were held at –40 mV. (C) Average concentration-response curves for glycine (black), β-alanine (green), AMS (blue), and taurine (red), n=6–9 cells. Responses of AMS, β-alanine, and taurine are normalized to those to a saturating concentration of glycine (100 mM) in each cell. AMS, aminomethanesulfonic acid.
|

(A, B) Representative single-channel current recordings of zebrafish α1 GlyR activity evoked by high concentrations of agonists. Recordings were made in the cell attached configuration at +100 mV holding potential. (C) Boxplots of maximum Popen values for clusters with the different agonists (one point per cluster). Boxes and whiskers show the 25th and 75th and the 5th and 95th percentiles, respectively. The horizontal black line in the box is the median.
|

(A–C) Cryo-EM density maps for desensitized, open, and expanded-open states with one subunit highlighted. The AMS density is in red. (D–F) Atomic models for desensitized, open, and expanded-open states. Shown are GlyR in cartoon representation, AMS in sphere representation (red), and N-glycans in stick representation. AMS, aminomethanesulfonic acid; EM, electron microscopy.
|
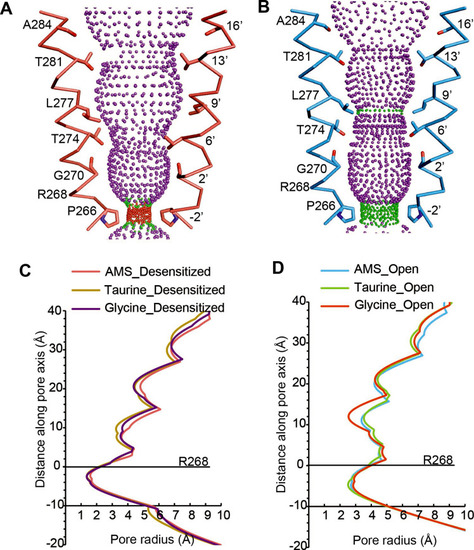
(A, B) Shape and ion permeation pathway for AMS-bound desensitized (see also (C)) and open (see also (D)) states. M2 helices and key amino acids are shown in ribbon and stick representation, respectively. Purple, green, and red spheres define radii >3.5 Å, 1.8–3.5 Å, and <1.8 Å. (C, D) Profiles of pore radii calculated by the HOLE program for desensitized (A) and open (B) states bound with AMS, taurine, and glycine. The Cα position of R268 was set to 0. AMS, aminomethanesulfonic acid.
|

(A) Two adjacent GlyR subunits are shown in cartoon representation. The agonist binding pocket is indicated by a black box. (B, C) Stereo figures of the binding sites showing likely hydrogen and cation-π interactions with AMS (B) and glycine (C) bound, respectively. Numbers are the distances in Å of probable cation- π interactions. Numbering of residues includes the signal peptide of 16 amino acids. (D) Comparison of the positions of key binding residues in the open states of the glycine (salmon), taurine (green), and AMS (blue) complexes, obtained by superposing the respective ECDs. (E) Schematic diagram illustrating the distances (Å) between the Cα atoms of key amino acids in glycine-, taurine-, and AMS-bound open states. AMS, aminomethanesulfonic acid; ECD, extracellular domain.
|

(A) Superposition of the ECD-TMD interface of the open states of the glycine (salmon), taurine (green), or AMS (blue) bound forms. The key amino acids at the ECD-TMD interface are shown in stick representation. Key secondary structure elements are labelled. The blue spheres represent the centers of mass of the secondary structure elements for the AMS-bound structure. (B) Schematic diagram illustrating the distances (Å) of the center of mass points shown in panel (A) of glycine-, taurine-, and AMS-bound open states. ECD, extracellular domain; TMD, transmembrane domain.
|

Thermodynamic cycle for the four GlyR agonists functionally characterized, showing their structure and example sweeps of the single-channel activity they elicit. |