
|
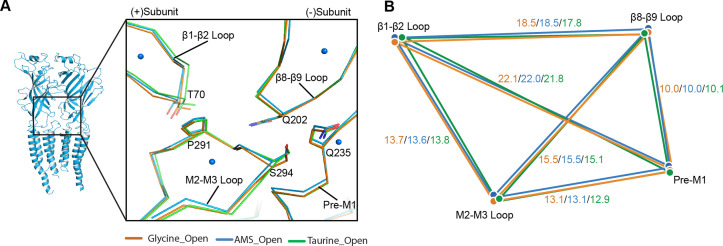
Figure 6.
(A) Superposition of the ECD-TMD interface of the open states of the glycine (salmon), taurine (green), or AMS (blue) bound forms. The key amino acids at the ECD-TMD interface are shown in stick representation. Key secondary structure elements are labelled. The blue spheres represent the centers of mass of the secondary structure elements for the AMS-bound structure. (B) Schematic diagram illustrating the distances (Å) of the center of mass points shown in panel (A) of glycine-, taurine-, and AMS-bound open states. ECD, extracellular domain; TMD, transmembrane domain.
Comparison of the ECD-TMD interface in different agonist-bound complexes.