
|
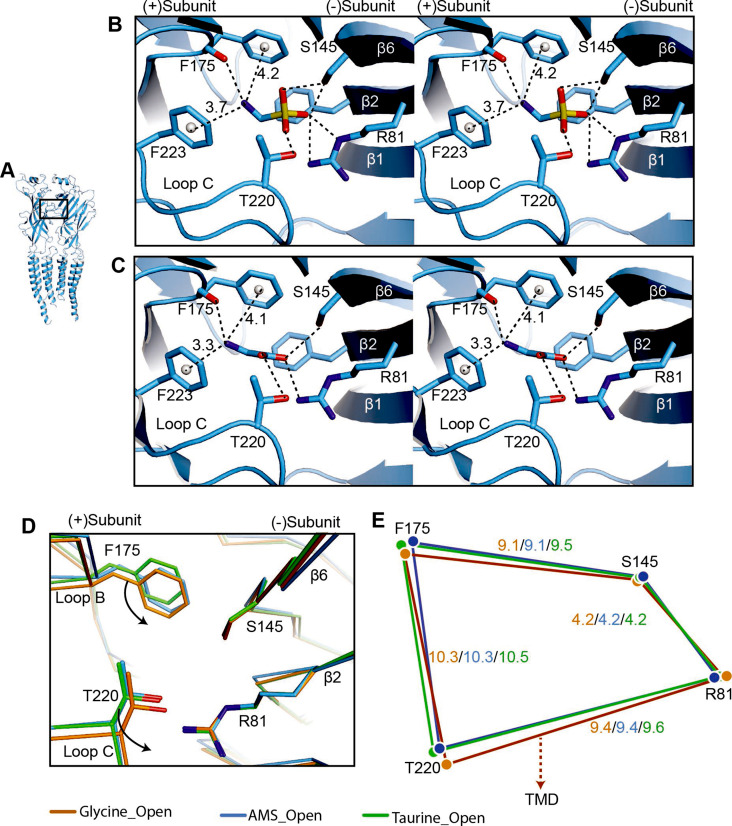
Figure 5
(A) Two adjacent GlyR subunits are shown in cartoon representation. The agonist binding pocket is indicated by a black box. (B, C) Stereo figures of the binding sites showing likely hydrogen and cation-π interactions with AMS (B) and glycine (C) bound, respectively. Numbers are the distances in Å of probable cation- π interactions. Numbering of residues includes the signal peptide of 16 amino acids. (D) Comparison of the positions of key binding residues in the open states of the glycine (salmon), taurine (green), and AMS (blue) complexes, obtained by superposing the respective ECDs. (E) Schematic diagram illustrating the distances (Å) between the Cα atoms of key amino acids in glycine-, taurine-, and AMS-bound open states. AMS, aminomethanesulfonic acid; ECD, extracellular domain.
Comparison of agonist binding sites.