
|
Figure 3
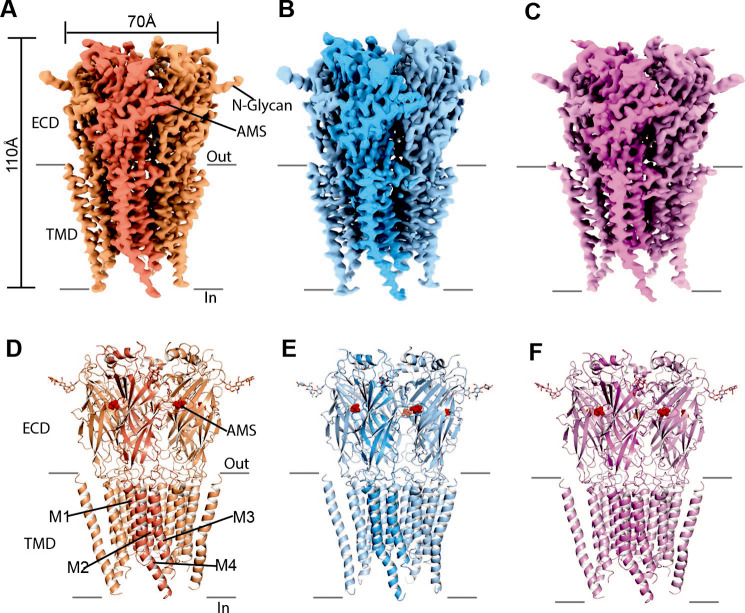
(A–C) Cryo-EM density maps for desensitized, open, and expanded-open states with one subunit highlighted. The AMS density is in red. (D–F) Atomic models for desensitized, open, and expanded-open states. Shown are GlyR in cartoon representation, AMS in sphere representation (red), and N-glycans in stick representation. AMS, aminomethanesulfonic acid; EM, electron microscopy.
Cryo-EM analysis of structures of zebrafish α1 GlyR bound to AMS.