
|
Figure 2
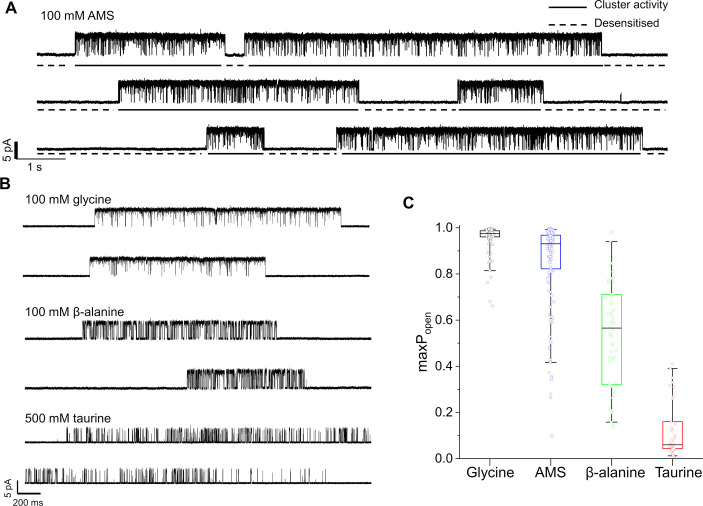
(A, B) Representative single-channel current recordings of zebrafish α1 GlyR activity evoked by high concentrations of agonists. Recordings were made in the cell attached configuration at +100 mV holding potential. (C) Boxplots of maximum Popen values for clusters with the different agonists (one point per cluster). Boxes and whiskers show the 25th and 75th and the 5th and 95th percentiles, respectively. The horizontal black line in the box is the median.
Maximum open probability evoked by different GlyR agonists.