
|
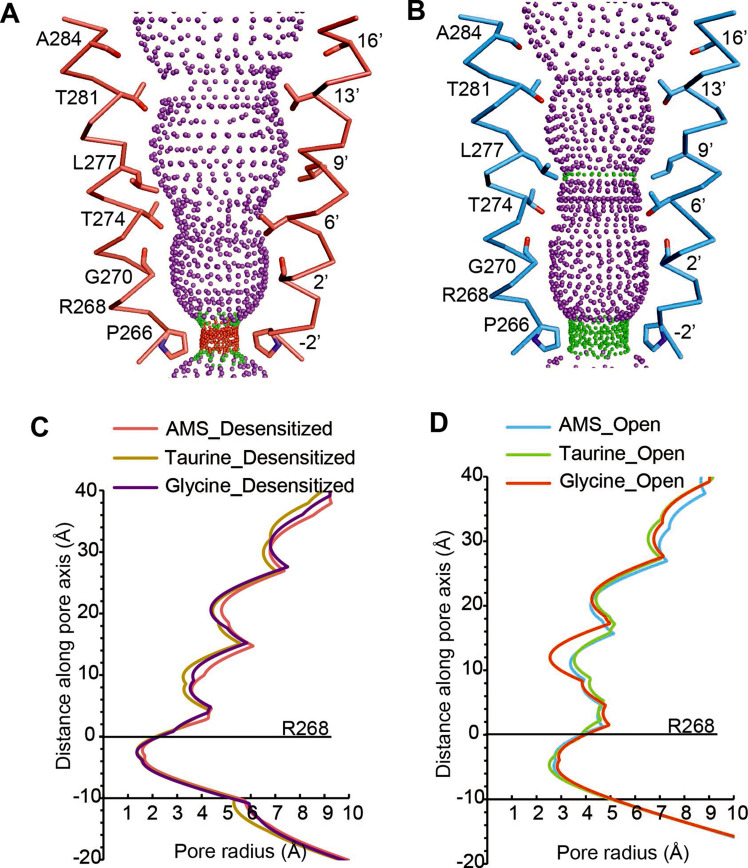
Figure 4.
(A, B) Shape and ion permeation pathway for AMS-bound desensitized (see also (C)) and open (see also (D)) states. M2 helices and key amino acids are shown in ribbon and stick representation, respectively. Purple, green, and red spheres define radii >3.5 Å, 1.8–3.5 Å, and <1.8 Å. (C, D) Profiles of pore radii calculated by the HOLE program for desensitized (A) and open (B) states bound with AMS, taurine, and glycine. The Cα position of R268 was set to 0. AMS, aminomethanesulfonic acid.
Comparison of ion channel pores.