
- Title
-
A transgenic zebrafish for in vivo visualization of cilia
- Authors
- Zhang, H., Huang, Z., Lv, L., Xin, Y., Wang, Q., Li, F., Dong, L., Wu, C., Ingham, P.W., Zhao, Z.
- Source
- Full text @ Open Biol.
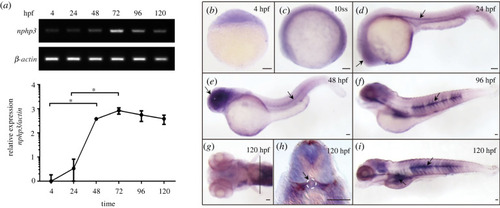
Expression analysis of zebrafish Nphp3. ( |
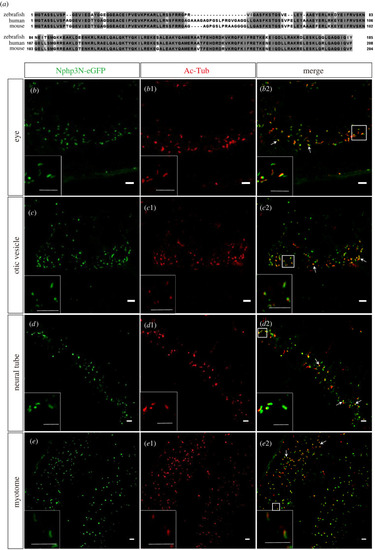
Transient expressed N-terminal peptide of zNphp3 (zNphp3N) fused eGFP localized to PC in zebrafish embryos. ( |
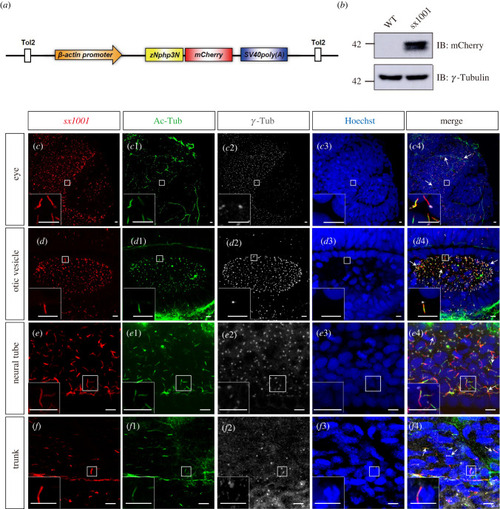
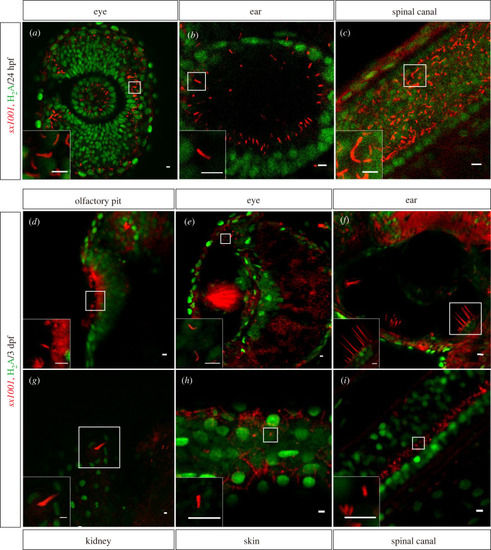
Stable transgenic lines EXPRESSION / LABELING:
|
Nphp3N-mCherry integration into PHENOTYPE:
|
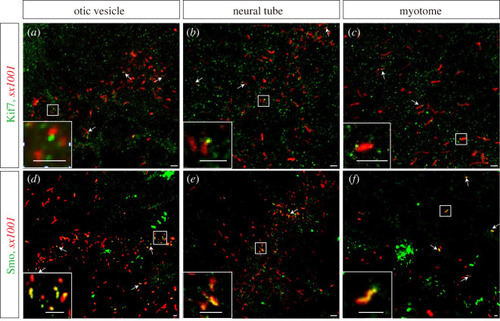
EXPRESSION / LABELING:
|
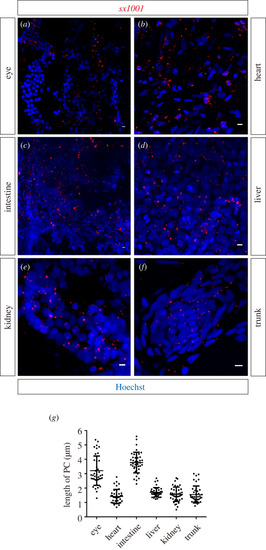
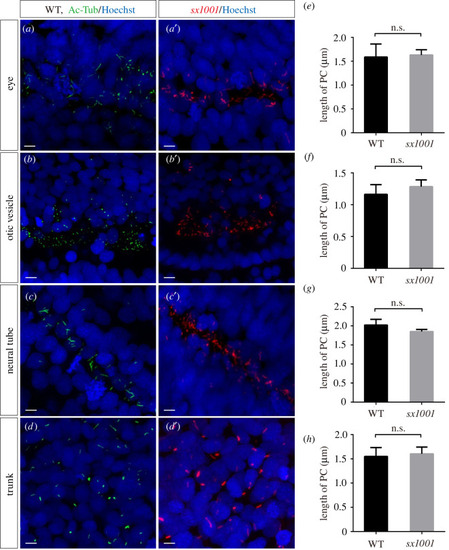
Cilia in adult EXPRESSION / LABELING:
|
|