
Figure 1
- ID
- ZDB-IMAGE-220814-2
- Genes
- Publication
- Zhang et al., 2022 - A transgenic zebrafish for in vivo visualization of cilia
- All Figures
- Figures for Zhang et al., 2022
|
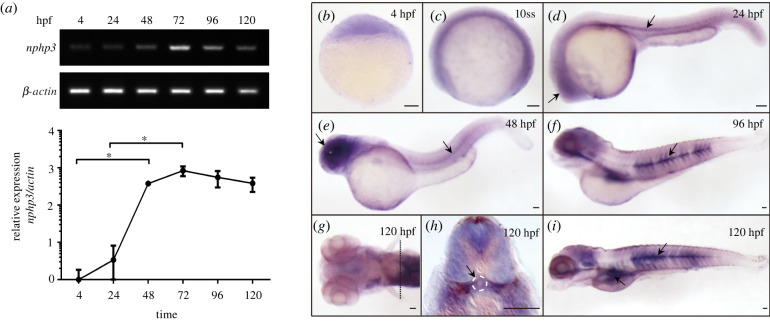
Figure 1
Expression analysis of zebrafish Nphp3. (