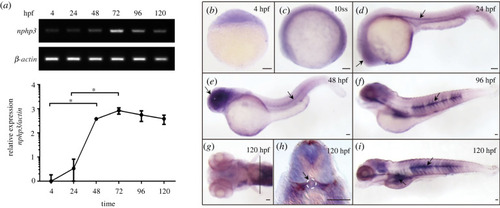
Expression analysis of zebrafish Nphp3. (a) The upper panel is the RT-PCR image of znphp3 expression from 4 hpf to 120 hpf. β-actin was used as an internal control. The qRT-PCR was used to quantify nphp3 mRNA levels in wild larvae as shown in the lower panel. The expression of znphp3 was normalized by β-actin mRNA. The vertical coordinate is the logarithm with log10 as the base. Vertical bars represent the standard deviation (n = 3). One-way ANOVA was used for analysis. Significant values are noted as *p ≤ 0.05. (b–i) Whole-mount in situ hybridization of zebrafish nphp3 (znphp3) in wild zebrafish embryos at different stages. (b) ubiquitous expression of znphp3 was observed at sphere stage (4 hpf; embryo shown with animal pole to the top); (c) znphp3 mRNA was uniformly distributed throughout the embryo at 10ss; (d,e) znphp3 mRNA accumulated primarily in the ventral portion of the larvae, the retina, and the horizontal myoseptum region during 24–48 hpf; (f) the expression at the horizontal myoseptum remained and spread to the intermediated muscle fibres at 96 hpf; (g–i) znphp3 mRNA was found at the majority of the somatic borders and was slightly expressed at the pronephros glomerulus at 120 hpf (as shown in the dotted line in g). Arrows point to tissues with enriched expression of znphp3. Scale bar, 100 µm.
|
