
- Title
-
A viral toolbox for conditional and transneuronal gene expression in zebrafish
- Authors
- Satou, C., Neve, R.L., Oyibo, H.K., Zmarz, P., Huang, K.H., Arn Bouldoires, E., Mori, T., Higashijima, S.I., Keller, G.B., Friedrich, R.W.
- Source
- Full text @ Elife

( |
( |
( |
( |
( |
( |
( |
( |
( |
( |
( |
( |
( |
( |
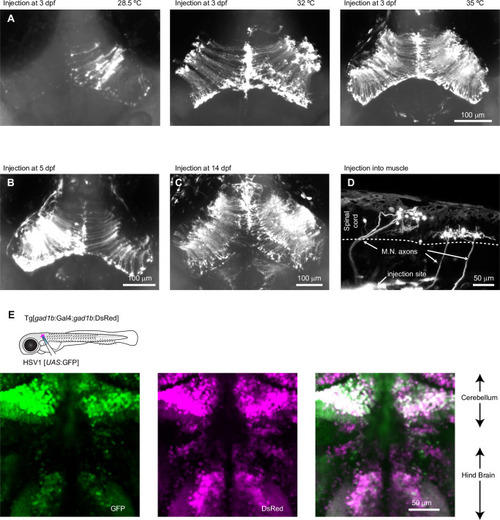
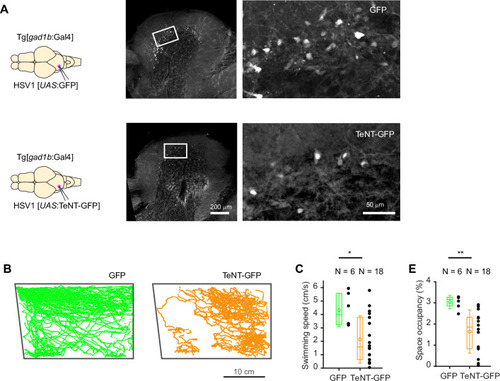
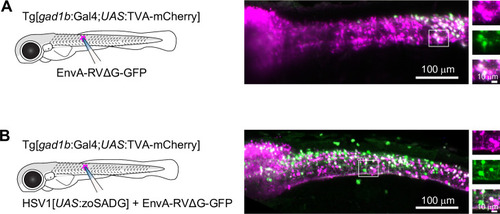
Expression of GFP in the cerebellum after sequential injection of (1) HSV1[ |
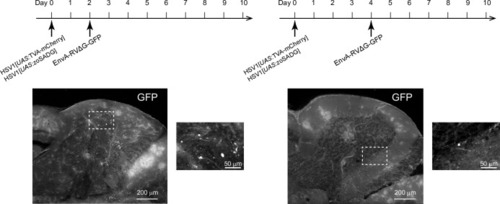
Expression of GFP in the cerebellum after sequential injection of (1) HSV1[ |
( |

( |
( |