
- Title
-
Slc38a9 Deficiency Induces Apoptosis and Metabolic Dysregulation and Leads to Premature Death in Zebrafish
- Authors
- Wu, X., Chen, J., Liu, C., Wang, X., Zhou, H., Mai, K., He, G.
- Source
- Full text @ Int. J. Mol. Sci.
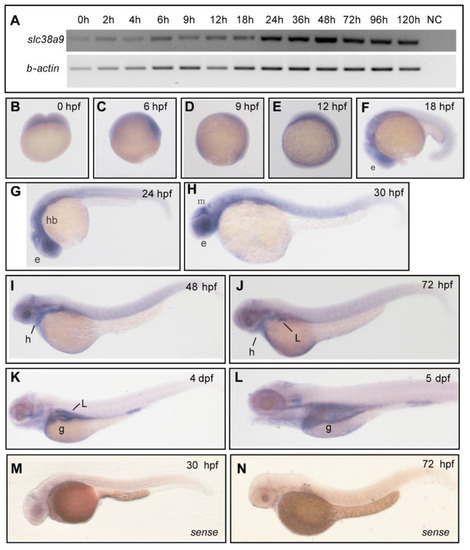
Figure 1. Spatiotemporal expression pattern of slc38a9 in zebrafish. (A) RT-PCR analysis of zebrafish slc38a9 mRNA at the indicated embryonic stages. Numbers indicate different developmental stages as hours post-fertilization. NC, negative control. β-actin as the internal control. (B–L) Wholemount in situ hybridization (WISH) reveals the slc38a9 mRNA expression pattern in the zebrafish embryos at the indicated embryonic stages. slc38a9 expression is ubiquitous from the one-cell stage to 12 hpf (B–E), restricted to the retina at 18 (F), 24 (G), and 30 hpf (H). The slc38a9 expression encompasses the heart and midbrain region at 30 (H) and 48 hpf (I). From 72 hpf to 5 dpf, the slc38a9 expression is restricted to the liver and gut (J,L). (M,N) Views of zebrafish embryos hybridized with sense zebrafish slc38a9 probe. Abbreviations: e, eye, mb, midbrain; g, gut; hb, hindbrain; l, liver; h, heart.
|

Figure 2. Knockout slc38a9 cause developmental defects in zebrafish. (A) Zebrafish slc38a9 gene structure. The selected Cas9 target sites sequence (blue) is in the second exon of the zebrafish slc38a9 gene. The PAM sequence is colored in pink. (B) The sequencing trace data of wild type and slc38a9 mutant alleles. The black shade is a premature stop codon. (C) The upper panel is the SLC38a9 protein sequences of WT and mutants. The lower panel is the schematic of the predicted SLC38A9 protein domains of WT and mutants. (D) Relative expression levels of slc38a9 mRNA in mutant and WT zebrafish at 3 dpf. The mRNA levels of slc38a9 were measured by qRT-PCR and normalized by β-actin mRNA levels. Data shown are mean ± SEM, n = 3. Different letters indicate significant differences at p < 0.05. (E) Live images of WT and mutant at the indicated developmental stage. The Arrowhead indicates the smaller eyes of the mutant, and arrow indicates the edematous pericardial cavity of the mutant. Scale bar = 500 μm. (F, G) The body length of mutant zebrafish was shorter than WT at 24 and 72 hpf. Data shown are mean ± SEM, n = 10. * p < 0.05, ** p < 0.01. (H) Viability of wild type and slc38a9 mutant larvae.
EXPRESSION / LABELING:
PHENOTYPE:
|

Figure 3. RNA sequencing analysis of slc38a9 mutant zebrafish. (A) Principal component analysis (PCA) plot of four wild type and slc38a9 mutant RNA-seq datasets. Principal component 1 (PC1), principal component 2 (PC2), and principal component 3 (PC3) were used for analysis. (B) Volcano plot of differential expression analysis of slc38a9 mutant and control larvae showing the relationship between −log10(padj) and log2FoldChanges. The red dot shows upregulated genes, the green dot shows downregulated genes, and the blue dot shows an unchanged gene. (C) Gene ontology (GO) analysis of differentially expressed genes in biological processes (red column), cellular component (green column), and molecular function (blue column). (D) The directed acyclic graph (DAG) of biological process. The lower terms are more specific, while the upper terms are more general. (E) Average heart rate of 60 hpf WT and slc38a9 mutant zebrafish larvae. Data shown are mean ± SEM, n = 10. * p < 0.05. (F) Correlation between qRT-PCR and RNA-seq results for select DEGs. The fold change values derived from the RNA-seq analysis of DEGs are compared with those obtained by qRT-PCR determined by 2−ΔΔCT. The reference line indicates the expected linear relationship.
|
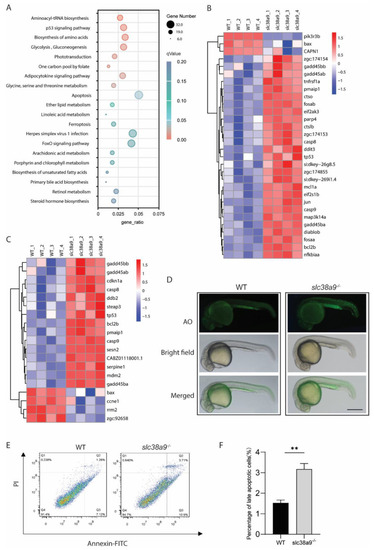
Figure 4. Slc38a9 Deficiency induces apoptosis and alters multiple metabolic pathways. (A) Kyoto Encyclopedia of Genes and Genomes (KEGG) enrichment analysis of differentially expressed genes. The X-axis indicates gene ratio, the size of dots represents the number of genes in the pathway, and the color indicates the size of the qValue. (B) Heatmaps of transcripts in apoptosis enrichment. (C) Heatmaps of transcripts in p53 signaling pathway enrichment. (D) Larvae were stained with AO to visualize apoptotic cells identified as green punctate dots. Scale bar = 500μm. (E) Annexin/PI apoptosis analysis in WT and slc38a9 mutant zebrafish embryos (3 dpf). (F) The percentage of late apoptosis cells in WT and slc38a9 mutant zebrafish embryos. Data shown are mean ± SEM, n = 3. ** p < 0.01.
PHENOTYPE:
|
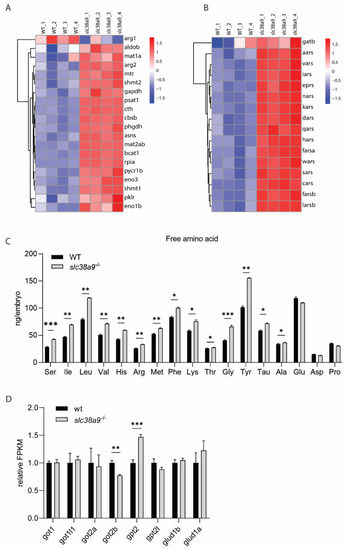
Figure 5. Biosynthesis of amino acids and aminoacyl-tRNA were enhanced in slc38a9−/− embryos. (A) Heatmaps of transcripts in the biosynthesis of amino acids’ enrichment. (B) Heatmaps of transcripts in aminoacyl-tRNA synthetases’ enrichment. (C) Most free amino acids (FAAs) increased in slc38a9−/− mutants. The contents of most FAAs (Leu, Met, Ile, Val, Lys, etc.) increased except for Pro, Glu, and Asp. The profile of FAAs was measured using the automated amino acid analyzer. (D) The relative FPKM of major aminotransferases in WT and slc38a9 mutant zebrafish embryos (60 hpf). Data shown are mean ± SEM, n = 3. * p < 0.05, ** p < 0.01, *** p < 0.005.
EXPRESSION / LABELING:
PHENOTYPE:
|

Figure 6. Slc38a9 regulates glycolysis and gluconeogenesis in zebrafish embryos. (A) Heatmaps of transcripts in glycolysis and gluconeogenesis enrichment. (B–E) Concentrations of glucose (B), glucose-6-phosphate (C), pyruvate (D), and lactate (E) in WT and slc38a9 mutant zebrafish embryos (60 hpf) measured by LC-MS/MS. Data shown are mean ± SEM, n = 3. Different letters indicate significant differences at p < 0.05.
PHENOTYPE:
|
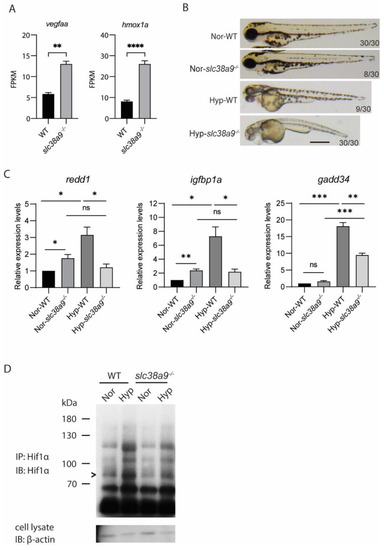
Figure 7. Slc38a9 deficiency leads to dysregulated hypoxia response. (A) The FPKM of hypoxia-induced genes in WT and slc38a9 mutant zebrafish embryos (60 hpf). (B) The phenotypic penetrance of the slc38a9 mutant increased under hypoxia treatment. Zebrafish larvae (24 hpf) were treated with hypoxia embryo rearing solution (DO = 1 mg/L) for 10 h. Normoxia (Nor) and hypoxia (Hyp). (C) The hypoxia-induced increase of Hif1α target genes was blocked in the slc38a9 mutant zebrafish. The experimental groups were the same as described in (B). The expression of Hif1α target genes was detected by qRT-qPCR and normalized by the β-actin mRNA levels. The mRNA levels of Hif1α target genes were upregulated in WT zebrafish larvae under hypoxic conditions, while this increase was completely blocked in the slc38a9 mutant. Data shown are mean ± SEM, n = 3. * p < 0.05, ** p < 0.01, *** p < 0.005, **** p < 0.001. (D) The increase of Hif1α protein level was attenuated in slc38a9 mutants under hypoxic conditions. The experimental groups were the same as described in (B). The immunoprecipitation was used to enrich the Hif1α protein. The representative result is shown in (D). > Hif1α.
|