
IMAGE
Figure 6
- ID
- ZDB-IMAGE-220430-149
- Publication
- Wu et al., 2022 - Slc38a9 Deficiency Induces Apoptosis and Metabolic Dysregulation and Leads to Premature Death in Zebrafish
- All Figures
- Figures for Wu et al., 2022
Image
|
Figure Caption
Figure 6
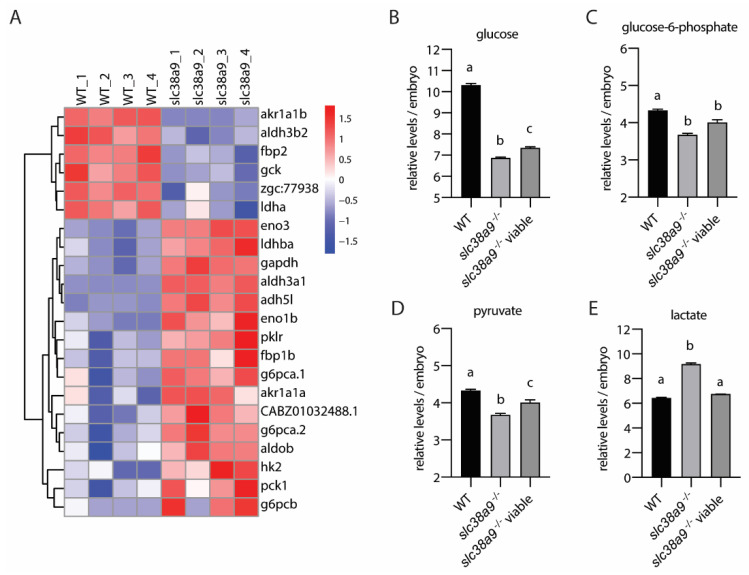
Figure 6. Slc38a9 regulates glycolysis and gluconeogenesis in zebrafish embryos. (A) Heatmaps of transcripts in glycolysis and gluconeogenesis enrichment. (B–E) Concentrations of glucose (B), glucose-6-phosphate (C), pyruvate (D), and lactate (E) in WT and slc38a9 mutant zebrafish embryos (60 hpf) measured by LC-MS/MS. Data shown are mean ± SEM, n = 3. Different letters indicate significant differences at p < 0.05.
Figure Data
Acknowledgments
This image is the copyrighted work of the attributed author or publisher, and
ZFIN has permission only to display this image to its users.
Additional permissions should be obtained from the applicable author or publisher of the image.
Full text @ Int. J. Mol. Sci.