
- Title
-
A Novel 2-Hit Zebrafish Model to Study Early Pathogenesis of Non-Alcoholic Fatty Liver Disease
- Authors
- Kulkarni, A., Ibrahim, S., Haider, I., Basha, A., Montgomery, E., Ermis, E., Mirmira, R.G., Anderson, R.M.
- Source
- Full text @ Biomedicines
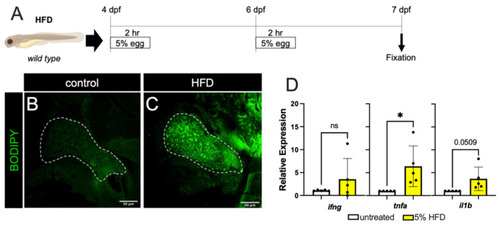
High fat diet treatment. (A) The schematic for high-fat diet feedings of the zebrafish larvae. (B,C) BODIPY labeling of unfed (B) and 5% High-fat Diet (HFD) fed larvae (C). There is minimal accumulation of lipid droplets in the liver of unfed larvae (outlined by dashed white line), while HFD treatment resulted in significant accumulation of lipid droplets in hepatocytes. (D) The larval mRNA level of tnfa only is significantly increased in response to HFD. Expression analyses were performed on whole larvae. Statistical analyses by students t-test, n = 4–5 clutches with at least 15 embryos per clutch. ns—not significant,* p < 0.05. |
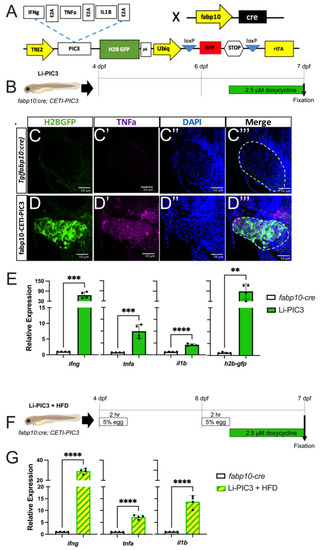
Hepatic induction of proinflammatory cytokines. (A) Diagram of the CETI-PIC3 transgene that is enabled in a hepatocyte-specific manner by fabp10:cre. (B) Experimental scheme for induction of the PIC3 cytokines at 6 dpf. (C–D’’’) Immunostaining of 7 dpf Tg(fabp10:cre) control larvae (C) and Li-PIC3 larvae (D) for GFP (green, C,D), TNFα (magenta, C’,D’), DNA (blue, C’’,D’’), and the merged images (C’’’,D’’’). The PIC3 cassette was strongly induced by doxycycline, as evidenced by both GFP and TNFα labeling in the liver (outlined by dashed white line). (E) The levels of ifng, tnfa, il1b, and H2B-GFP are all increased after doxycycline induction in the Li-PIC3 embryos as compared to Tg(fabp10:cre) control embryos. (F) Diagram for combined HFD followed by dox induction in zebrafish larvae. (G) The levels of ifng, tnfa, and il1b are all increased in Li-PIC3/HFD larvae as compared to Tg(fabp10:cre) control embryos. Expression analyses were performed on whole larvae. Statistical analyses by students t-test, n = 4–5 clutches with at least 15 embryos per clutch. ** p < 0.01, *** p < 0.001, **** p < 0.0001. |
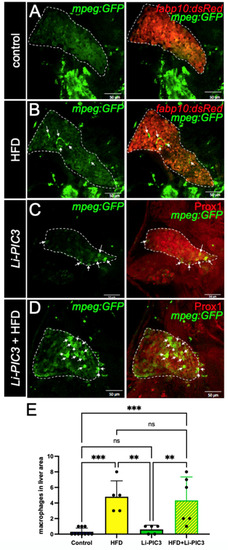
Macrophage infiltration is increased in HFD, Li-PIC3, and Li-PIC3+HFD larvae. (A–D) 7 dpf larvae labeled with GFP immunostaining to reveal macrophages and either a 2CLIP transgene (A,B) or immunolabeled with Prox1 antibody (C,D) to reveal hepatocytes. Infiltrating macrophages are indicated by white arrows. (E) Quantification of macrophages within the liver boundary reveals a statistically significant increase with HFD and Li-PIC3+HFD treatments. Statistical analysis by one-way ANOVA, ns-non significant, ** p < 0.01, *** p < 0.001. |
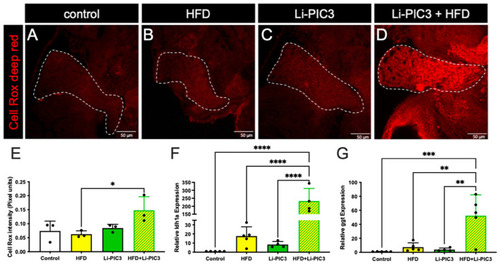
ROS mediated stress is induced in livers of zebrafish fed a high-fat diet and liver-specific cytokine induced embryos. (A–D) Cell Rox Deep Red staining used to visualize ROS-mediated stress in the livers of control, HFD-fed, Li-PIC3, and Li-PIC+HFD larvae. (E) Quantification of Cell Rox intensity demonstrated an increase in only Li-PIC3+HFD embryos as compared to Tg(fabp10:cre) controls, while the comparison to controls trended towards significance (p = 0.776). (F) Quantification of ldh1a mRNA levels by qPCR (G) Quantification of ggt mRNA levels by qPCR. Both ldh1a and ggt are elevated in the combined Li-PIC3+HFD condition. Statistical analysis was by one-way ANOVA, n = 4–5 per condition; * p < 0.05, ** p < 0.01, *** p < 0.001, **** p < 0.0001. |

Hyperglycemia is induced without loss of β cells in HFD, Li-PIC3, and Li-PIC3+HFD larvae. (A) Blood glucose levels for Tg(fabp10:cre), HFD, Li-PIC3, and Li-PIC3+HFD larvae. (B) β cell count in Tg(fabp10:cre), HFD, Li-PIC3, and Li-PIC3+HFD larvae. (C) Transcript levels for insulin Tg(fabp10:cre), HFD, Li-PIC3, and Li-PIC3+HFD larvae. (D) Levels of pck1, a marker of gluconeogenesis, in Tg(fabp10:cre), HFD, Li-PIC3, and Li-PIC3+HFD larvae. Statistical analysis was by one-way ANOVA, n = 3–9; * p < 0.05, ** p < 0.01, *** p < 0.001, **** p < 0.0001. |
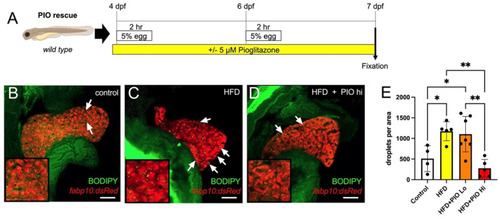
Pioglitazone treatment reduces lipid droplet accumulation in the liver. (A) Experimental scheme of PIO treatment. Larvae were immersed in PIO+ 0.1% DMSO for 1 h prior to the first HFD treatment and remained in PIO throughout. (B–D) Representative optical slices of BODIPY-stained 2CLIP zebrafish liver depicting (B) untreated controls, (C) HFD-fed larvae, and (D) HFD-fed + PIO hi (5 µM) treated larvae; hepatocytes are labeled in red via expression of the transgene fabp10:dsRed and examples of green-labeled lipid droplets are indicated by arrows. (E) Quantification of lipid droplets in hepatocytes area as executed with FIJI software. Statistical analysis was by one-way ANOVA; * p < 0.05, ** p < 0.01. Scale bar = 50 µm. PHENOTYPE:
|