
IMAGE
Figure 3
- ID
- ZDB-IMAGE-220402-30
- Genes
- Antibodies
- Publication
- Kulkarni et al., 2022 - A Novel 2-Hit Zebrafish Model to Study Early Pathogenesis of Non-Alcoholic Fatty Liver Disease
- All Figures
- Figures for Kulkarni et al., 2022
Image
|
Figure Caption
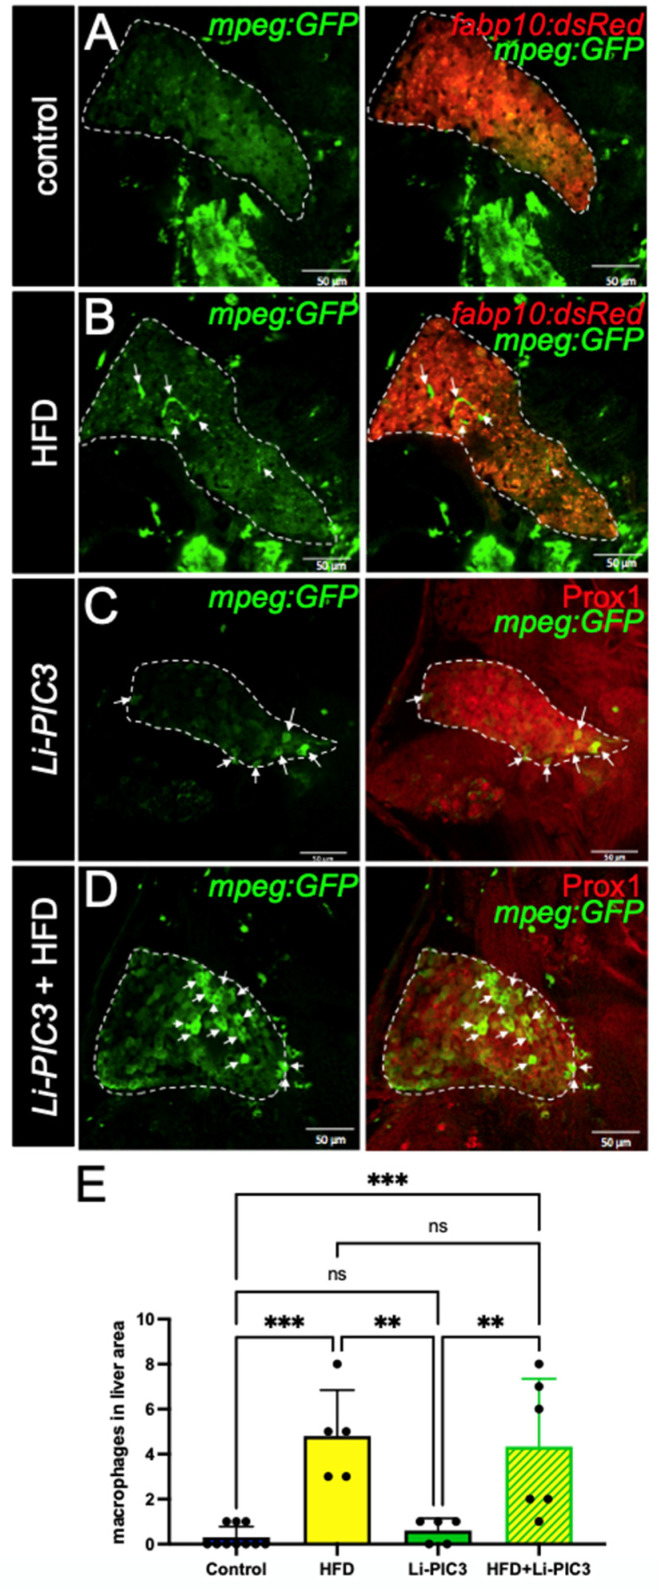
Figure 3
Macrophage infiltration is increased in HFD, Li-PIC3, and Li-PIC3+HFD larvae. (A–D) 7 dpf larvae labeled with GFP immunostaining to reveal macrophages and either a 2CLIP transgene (A,B) or immunolabeled with Prox1 antibody (C,D) to reveal hepatocytes. Infiltrating macrophages are indicated by white arrows. (E) Quantification of macrophages within the liver boundary reveals a statistically significant increase with HFD and Li-PIC3+HFD treatments. Statistical analysis by one-way ANOVA, ns-non significant, ** p < 0.01, *** p < 0.001.
Figure Data
Acknowledgments
This image is the copyrighted work of the attributed author or publisher, and
ZFIN has permission only to display this image to its users.
Additional permissions should be obtained from the applicable author or publisher of the image.
Full text @ Biomedicines