Figure 2
Figure 2
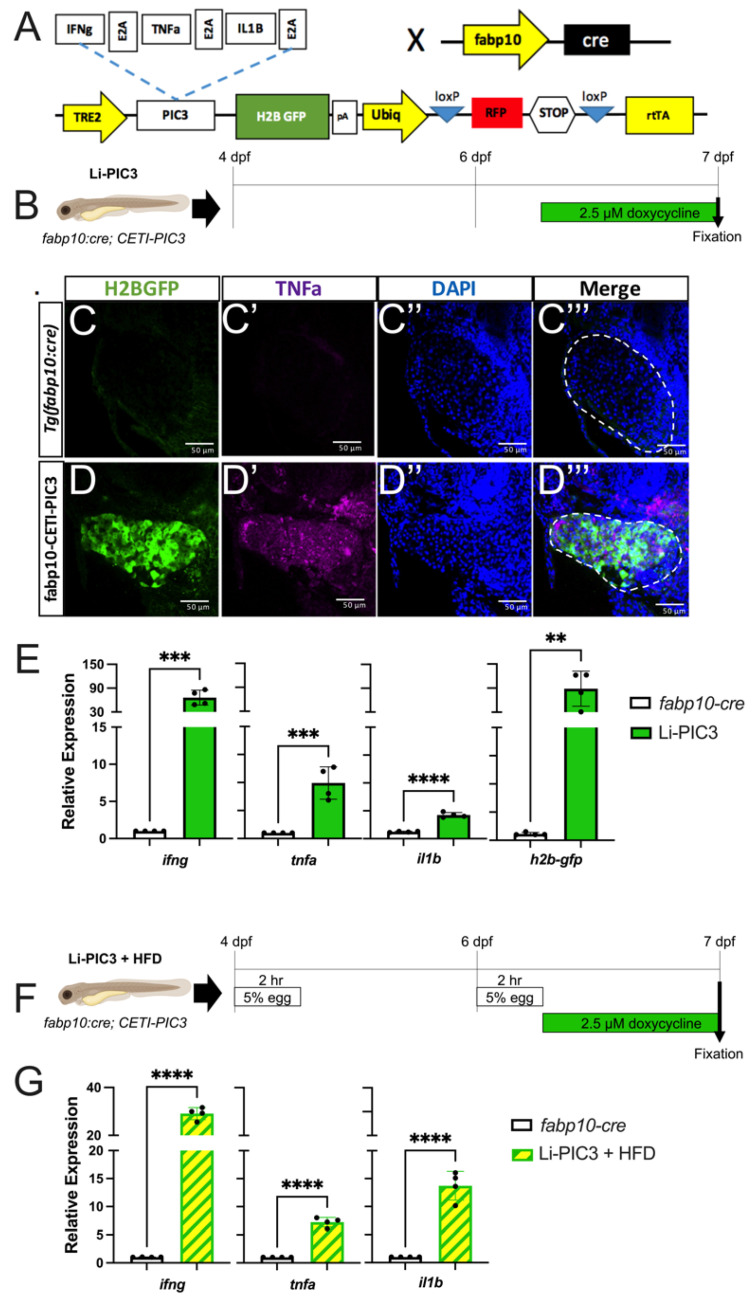
Hepatic induction of proinflammatory cytokines. (A) Diagram of the CETI-PIC3 transgene that is enabled in a hepatocyte-specific manner by fabp10:cre. (B) Experimental scheme for induction of the PIC3 cytokines at 6 dpf. (C–D’’’) Immunostaining of 7 dpf Tg(fabp10:cre) control larvae (C) and Li-PIC3 larvae (D) for GFP (green, C,D), TNFα (magenta, C’,D’), DNA (blue, C’’,D’’), and the merged images (C’’’,D’’’). The PIC3 cassette was strongly induced by doxycycline, as evidenced by both GFP and TNFα labeling in the liver (outlined by dashed white line). (E) The levels of ifng, tnfa, il1b, and H2B-GFP are all increased after doxycycline induction in the Li-PIC3 embryos as compared to Tg(fabp10:cre) control embryos. (F) Diagram for combined HFD followed by dox induction in zebrafish larvae. (G) The levels of ifng, tnfa, and il1b are all increased in Li-PIC3/HFD larvae as compared to Tg(fabp10:cre) control embryos. Expression analyses were performed on whole larvae. Statistical analyses by students t-test, n = 4–5 clutches with at least 15 embryos per clutch. ** p < 0.01, *** p < 0.001, **** p < 0.0001.

