
- Title
-
PRDM paralogs antagonistically balance Wnt/β-catenin activity during craniofacial chondrocyte differentiation
- Authors
- Shull, L.C., Lencer, E.S., Kim, H.M., Goyama, S., Kurokawa, M., Costello, J.C., Jones, K., Artinger, K.B.
- Source
- Full text @ Development
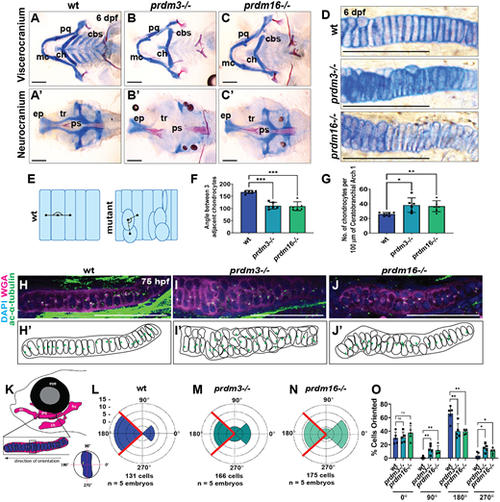
prdm3 and prdm16 are necessary for chondrocyte stacking and polarity in the zebrafish craniofacial skeleton. (A-G) Wild-type (wt), prdm3−/− and prdm16−/− zebrafish embryos were collected at 6 dpf and stained with Alcian Blue and Alizarin Red. (A-D) Images of dissected and flat-mounted viscerocranium (A-C) and neurocranium (A′-C′), and high magnification of chondrocytes (D). cbs, ceratobranchials; ch, ceratohyal; ep, ethmoid plate; mc, Meckel's cartilage; pq, palatoquadrate; ps, parasphenoid; tr, trabeculae. Scale bars: 100 µm. (E,F) Quantification of chondrocyte organization (F) as schematized in E (n=6 per genotype); mean±s.d. Black lines in E indicate angle measurement between adjacent chondrocytes. (G) Quantification of the number of chondrocytes per 100 µm of tissue (n=6 per genotype); mean±s.d. (H-O) Wild-type, prdm3−/− or prdm16−/− larvae were immunostained with acetylated α-tubulin to label MTOCs, denoting directional growth, and counterstained with DAPI and wheat germ agglutinin (WGA) at 75 hpf (H-J). Shown are lateral high-magnification views of the palatoquadrate. Scale bars: 50 µm. (H′-J′) Schematics showing misoriented chondrocytes. Green dots represent the localization of acetylated α-tubulin puncta. (K-O) Quantification of chondrocyte polarity (positioning of acetylated α-tubulin puncta), as depicted in K for wild type (L), prdm3−/− (M) and prdm16−/− (N). (O) Percentage of cells in each indicated quadrant normalized to the total number of cells for each genotype. (n=5 per genotype); mean±s.d. *P≤0.05, **P≤0.005, ***P≤0.001; ns, not significant (unpaired, two-tailed Student's t-test). PHENOTYPE:
|

Neural crest-specific function of Prdm3 and Prdm16 is required for chondrocyte organization in the Meckel's cartilage of the developing murine mandible. (A-J) Prdm3fl/fl or Prdm16fl/fl female mice were bred to Prdm3fl/+;Wnt1-Cre+/Tg or Prdm16fl/+;Wnt1-Cre+/Tg males and embryos were collected at the indicated time points. (A-C) Lateral images of the head show snout defects (white arrowheads) and mandible hypoplasia (white lines) in Prdm3 and Prdm16 mutants. (A′-C′) Alcian Blue- and Alizarin Red-stained mandibles were dissected from control or mutant animals. (A″-C″) Lateral views of the right half of the mandible. ap, angular process; cd, condylar process; cp, coronoid process; md, mandible. Black arrowheads and double arrowheads denote morphological irregularities in the mandible. (D,E) Quantification of anterior mandibular hypoplasia (ratio between the length of the anterior and posterior portions of the mandible; E) as schematized in D (n=3 per genotype); mean±s.d. (F-H) Safranin O- and Fast Green-stained sagittal sections of the Meckel's cartilage at E14.5 in control (F), Prdm3 (G) or Prdm16 (H) mutants. Scale bars: 100 µm. (F′-H′) High-magnification images of the chondrocytes from the boxed regions in F-H. Scale bars: 100 µm. (F″-H″) Schematics showing chondrocyte cell shapes. (I,J) Quantification of chondrocyte cell area (I) and cell number per tissue area (J) (n=3 per genotype); mean±s.d. *P≤0.05, **P≤0.005, #P<0.1; ns, not significant (unpaired, two-tailed Student's t-test). |
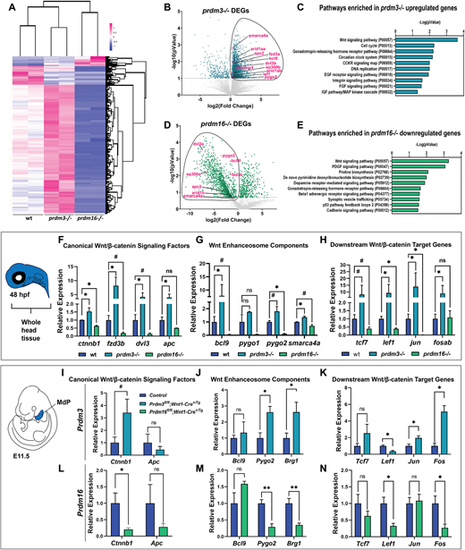
Prdm3 and Prdm16 differentially regulate Wnt/β-catenin signaling components in cranial NCCs. (A-E) RNA-seq was performed on sox10:EGFP FACS-sorted cranial NCCs at 48 hpf from wild-type, prdm3−/− and prdm16−/− zebrafish. (A) Heatmap showing z-scaled FPKM values for significant genes from prdm3−/− and prdm16−/− mutants. (B,D) Volcano plots showing the distribution of DEGs in prdm3−/− (B) and prdm16−/− (D), including Wnt/β-catenin signaling components (highlighted in magenta). (C,E) The upregulated genes in prdm3 mutants and downregulated genes in prdm16 mutants (circled in B and D) were subjected to GO (PANTHER) Pathway Enrichment Analysis. (F-H) Validation of RNA-seq transcriptomic changes on RNA isolated from whole heads pooled from five to seven embryos per genotype; mean±s.d. RT-qPCR was performed for selected Wnt/β-catenin signaling component genes, including canonical Wnt/β-catenin signaling factors (ctnnb1, fzd3b, dvl3, apc) (F); Wnt enhanceosome transcriptional complex members (bcl9, pygo1, pygo2, smarca4a) (G); and downstream Wnt/β-catenin target genes (tcf7, lef1, jun, fosab) (H). (I-N) Validation of zebrafish RNA-seq transcriptomic changes in E11.5 mouse mandibular processes. RT-qPCR was performed for selected genes, including canonical Wnt/β-catenin signaling factors (Ctnnb1, Apc) in Prdm3 (I) and Prdm16 (L) mutants; Wnt enhanceosome transcriptional complex members [Bcl9, Pygo2, Brg1 (Smarca4a)] in Prdm3 (J) and Prdm16 (M) animals; and downstream Wnt/β-catenin target genes (Tcf7, Lef1, Jun, Fos) in Prdm3 (K) and Prdm16 (N) mutants. n=3 per genotype; mean±s.d. MdP, mandibular process. *P≤0.05, **P≤0.005, #P≤0.1; ns, not significant (unpaired, two-tailed Student's t-test). |
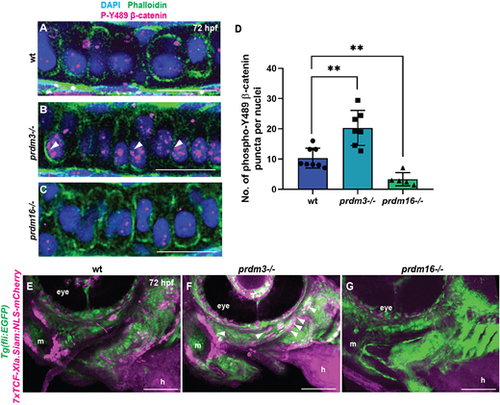
Prdm3 and Prdm16 control β-catenin stabilization and localization in craniofacial chondrocytes. (A-D) Wild-type (wt), prdm3−/− and prdm16−/− zebrafish embryos were collected at 75 hpf and immunostained for nuclear β-catenin (phosphorylated tyrosine 489) and counterstained with phalloidin and DAPI (A-C). Shown are high-magnification lateral images of the palatoquadrate. Increased nuclear β-catenin (magenta) was observed in prdm3−/− (white arrowheads in B), which was significantly reduced in prdm16−/− (C). (D) Quantification of the number of β-catenin puncta across ten nuclei per individual and averaged across at least five embryos per genotype; mean±s.d. Scale bars: 50 µm. (E-G) prdm3−/− and prdm16−/− mutant lines were crossed into the Wnt reporter line Tg(7xTCF-Xla.Siam:NLS-mCherry) to assess Wnt-responsive cells. Shown are representative lateral-ventral views of 75 hpf wild-type (E), prdm3−/− (F) and prdm16−/− (G) embryos. Increased Wnt-responsive cells were identified in the pharyngeal arch tissues of prdm3−/− (F) (white arrowheads), with a dramatic decrease in Wnt-responsive cells in prdm16−/− (G) mutants compared with wild type (E). h, heart; m, mouth. Scale bars: 100 µm. **P≤0.005 (unpaired, two-tailed Student's t-test). EXPRESSION / LABELING:
PHENOTYPE:
|

Prdm3 and Prdm16 alter chromatin accessibility at cis-regulatory regions of Wnt/β-catenin signaling components in cranial NCCs. (A-T) ATAC-seq was performed on sox10:EGFP FACS-sorted cells from wild-type, prdm3−/− and prdm16−/− zebrafish at 48 hpf. (A-D) Coverage heatmaps depicting the differences 1.5 kb upstream and downstream of centered peaks across the genome in controls (A,C), prdm3−/− (B) and prdm16−/− (D) mutants. (E,H) Venn diagrams representing the unique and overlapping differential ATAC-seq peaks based on differences in read depth across two replicates from prdm3−/− (E) and prdm16−/− (H) relative to their corresponding control groups as determined by DiffBind analysis. (F,I) Box plots representing the distribution of normalized read depth concentrations across all significant differential ATAC regions in prdm3−/− (F) and all differential ATAC regions in prdm16−/−. (I) compared with their respective controls. The interquartile range of the box extends from the 25th percentile to the 75th percentile with the line through the box representing the median. Whiskers extend to 1.5× the interquartile range with dots representing outliers. Derivation of these box plots was based a two-sided Wilcoxon Mann–Whitney test computed during DiffBind analysis. (G,J) Volcano plots showing distribution of differential ATAC peaks by fold change and significance in prdm3−/− (G) and prdm16−/− (J). Magenta dots represent those differential peaks meeting the threshold of P≤0.05. (K,L) Annotation of enriched peaks in prdm3−/− (K) and prdm16−/− (L). (M-O) Transcription factor occupancy prediction by investigation of ATAC-seq signal (T±) was performed on prdm3 and prdm16 mutant ATAC datasets. Shown are the top 10 transcription factors with predicted increased occupancy in prdm3−/− (M) and prdm16−/− (N) and decreased occupancy in prdm16−/− (O); P≤E−20. Each table shows the position weight matrix (PWM) for each transcription factor (TF) motif, the transcription factor family, and the differential binding score. (P-T) Tracks showing the distribution of peaks (chromatin accessibility), compared with previously published H3K27ac ChIP-seq datasets (Bogdanovic et al., 2012) from 48 hpf whole embryos, at specific Wnt/β-catenin signaling component target genes that were differentially expressed in prdm3 and prdm16 mutants: ctnnb1 (P), bcl9 (Q), pygo2 (R), jun (S) and fosab (T). (U-W) CUT&RUN paired with RT-qPCR was performed on 48 hpf whole zebrafish embryos with antibodies directed toward Prdm3, Prdm16 and H3K27ac. Enrichment (normalized to IgG) was assessed with primers flanking putative Prdm3- and Prdm16-binding sites near promoter regions (within 1000 bp of the TSS) of ctnnb1 (U), jun (V) and fosab (W). CUT&RUN-RT-qPCR experiments were performed three times; mean±s.d. is shown. *P≤0.05, #P≤0.1; ns, not significant (unpaired, two-tailed Student's t-test). PHENOTYPE:
|

Chondrocyte stacking defects with loss of prdm3 and prdm16 can be rescued by pharmacological manipulation of Wnt/β-catenin activity or genetically in prdm3−/−;prdm16−/− double mutants. (A-B) Wild-type (wt) or prdm3−/− zebrafish embryos were treated with suboptimal doses of 0.75 µM IWR-1 or DMSO (vehicle control) from 24 to 48 hpf. Inhibitor- and vehicle-treated larvae were collected at 6 dpf and stained with Alcian Blue or Alizarin Red. (A-A‴) High magnification of chondrocytes within cartilage structures. (B) Quantification of chondrocyte organization (angle between adjacent cells) (n=at least 5 per genotype per treatment group); mean±s.d. Scale bars: 100 µm. (C-D) Wild-type (wt) or prdm16−/− embryos were treated with suboptimal doses of 0.05 µM Gsk inhibitor XV (Wnt activator) or DMSO (vehicle control) from 24 to 48 hpf. Larvae were collected at 6 dpf and stained with Alcian Blue and Alizarin Red. (C-C‴) High magnification of chondrocytes within cartilage elements. (D) Quantification of chondrocyte organization (n=at least 10 per genotype per treatment group); mean±s.d. Scale bar: 100 µm. (E-H″) prdm3+/−;prdm16+/− heterozygous fish were generated and intercrossed. Larvae were collected at 6 dpf and stained with Alcian Blue and Alizarin Red. (E-H′) Dissected and mounted viscerocranium (E-H) and neurocranium (E′-H′) from wild type (E,E′), prdm3−/− (F,F′), prdm16−/− (G,G′) and prdm3−/−;prdm16−/− double mutants (H,H′). (E″-H″) High magnification of chondrocytes in cartilage elements of wild type (E″), prdm3−/− (F″), prdm16−/− (G″) and prdm3−/−;prdm16−/− double mutants (H″). cbs, ceratobranchials; ch, ceratohyal; ep, ethmoid plate; mc, Meckel's cartilage; pq, palatoquadrate; ps, parasphenoid; tr, trabeculae. (I) Quantification of the angle between adjacent chondrocytes across wild type, prdm3−/−, prdm16−/− and prdm3−/−;prdm16−/− double mutants, as well as all other combinatorial mutants indicated; mean±s.d. Scale bars: 100 µm. **P≤0.005; ns, not significant (unpaired, two-tailed Student's t-test). PHENOTYPE:
|
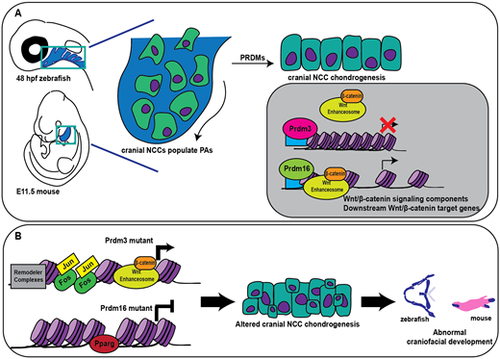
Prdm3 and Prdm16 function upstream of Wnt/β-catenin to balance transcriptional activity during craniofacial chondrogenesis. (A) In vertebrates, Prdm3 and Prdm16 facilitate cranial NCC chondrocyte differentiation and maturation by balancing temporal and spatial Wnt/β-catenin transcriptional activity; Prdm3 acts a repressor of gene expression and Prdm16 acts as an activator of similar gene targets, particularly Wnt/β-catenin signaling components and downstream Wnt/β-catenin target genes. (B) Loss of Prdm3 leads to enhanced gene expression and increased occupancy of chromatin remodelers and Jun/Fos whereas loss of Prdm16 causes a dramatic decrease in gene expression and increased occupancy of Pparg, among others. In both cases, Wnt/β-catenin signaling is abrogated leading to altered cranial neural crest chondrocyte differentiation and maturation, which ultimately leads to abnormal development of craniofacial structures. PAs, pharyngeal arches. |